
Atlantic American Corporation (AAME): Price and Financial Metrics
AAME Price/Volume Stats
| Current price | $1.58 | 52-week high | $3.00 |
| Prev. close | $1.60 | 52-week low | $1.49 |
| Day low | $1.51 | Volume | 12,145 |
| Day high | $1.63 | Avg. volume | 6,396 |
| 50-day MA | $1.69 | Dividend yield | 1.25% |
| 200-day MA | $2.07 | Market Cap | 32.29M |
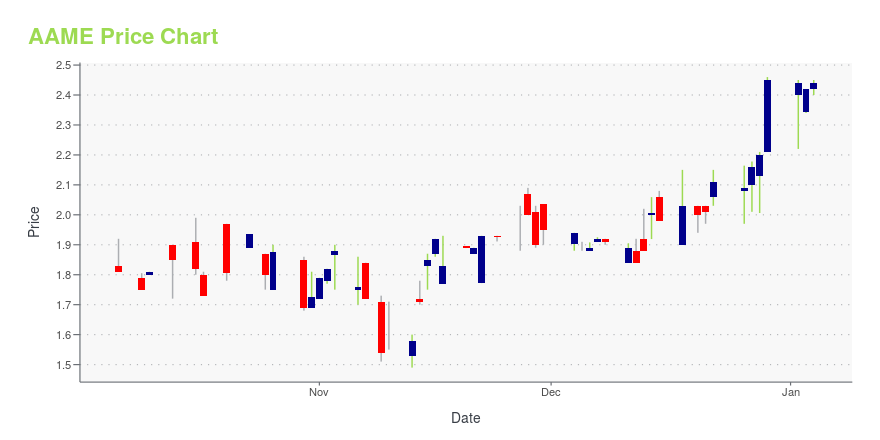
AAME Stock Price Chart Interactive Chart >
Latest AAME News From Around the Web
Below are the latest news stories about ATLANTIC AMERICAN CORP that investors may wish to consider to help them evaluate AAME as an investment opportunity.
Atlantic American Third Quarter 2023 Earnings: EPS: US$0.08 (vs US$0.038 loss in 3Q 2022)Atlantic American ( NASDAQ:AAME ) Third Quarter 2023 Results Key Financial Results Revenue: US$44.6m (down 3.8% from 3Q... |
Atlantic American Corporation Reports Third Quarter Results for 2023ATLANTA, Nov. 13, 2023 (GLOBE NEWSWIRE) -- Atlantic American Corporation (Nasdaq- AAME) today reported net income of $1.8 million, or $0.08 per diluted share, for the three month period ended September 30, 2023, compared to net loss of $0.7 million, or $(0.04) per diluted share, for the three month period ended September 30, 2022. The Company had net income of $2.1 million, or $0.09 per diluted share, for the nine month period ended September 30, 2023, compared to net income of $0.5 million, or |
One Atlantic American Insider Raised Their Stake In The Previous YearInsiders were net buyers of Atlantic American Corporation's ( NASDAQ:AAME ) stock during the past year. That is... |
Atlantic American Corporation Reports Second Quarter Results for 2023; Declares Annual DividendATLANTA, Aug. 08, 2023 (GLOBE NEWSWIRE) -- Atlantic American Corporation (Nasdaq- AAME) today reported net income for the three month period ended June 30, 2023 of $1.7 million, or $0.08 per diluted share, as compared to net loss of $1.7 million, or $0.09 per diluted share, for the comparable period in 2022. For the six month period ended June 30, 2023, the Company reported net income of $0.3 million, or nil per diluted share, as compared to net income of $1.2 million, or $0.05 per diluted share |
Atlantic American Corporation Reports Fourth Quarter and Year-End Results for 2022, First Quarter Results for 2023REPORTS BRING THE COMPANY CURRENT WITH ALL FILINGSATLANTA, June 30, 2023 (GLOBE NEWSWIRE) -- Atlantic American Corporation (Nasdaq: AAME) announced today that the Company has filed its Annual Report on Form 10-K for the year ended December 31, 2022 (the “Form 10-K”) and its Quarterly Report on Form 10-Q for the quarterly period ended March 31, 2023 (the “Form 10-Q”). As previously announced, the Company was unable to file its Form 10-K and Form 10-Q within the prescribed time periods because the |
AAME Price Returns
| 1-mo | -4.82% |
| 3-mo | -19.38% |
| 6-mo | -39.16% |
| 1-year | -13.80% |
| 3-year | -60.27% |
| 5-year | -29.47% |
| YTD | -34.94% |
| 2023 | 5.84% |
| 2022 | -3.92% |
| 2021 | 19.55% |
| 2020 | 4.57% |
| 2019 | -17.61% |
AAME Dividends
| Ex-Dividend Date | Type | Payout Amount | Change | ||||||
|---|---|---|---|---|---|---|---|---|---|
| Loading, please wait... | |||||||||
Continue Researching AAME
Want to do more research on Atlantic American Corp's stock and its price? Try the links below:Atlantic American Corp (AAME) Stock Price | Nasdaq
Atlantic American Corp (AAME) Stock Quote, History and News - Yahoo Finance
Atlantic American Corp (AAME) Stock Price and Basic Information | MarketWatch
Loading social stream, please wait...