ABM Industries Incorporated (ABM): Price and Financial Metrics
ABM Price/Volume Stats
Current price | $39.47 | 52-week high | $49.58 |
Prev. close | $38.96 | 52-week low | $37.61 |
Day low | $38.95 | Volume | 601,700 |
Day high | $39.72 | Avg. volume | 408,007 |
50-day MA | $43.64 | Dividend yield | 2.23% |
200-day MA | $44.36 | Market Cap | 2.59B |
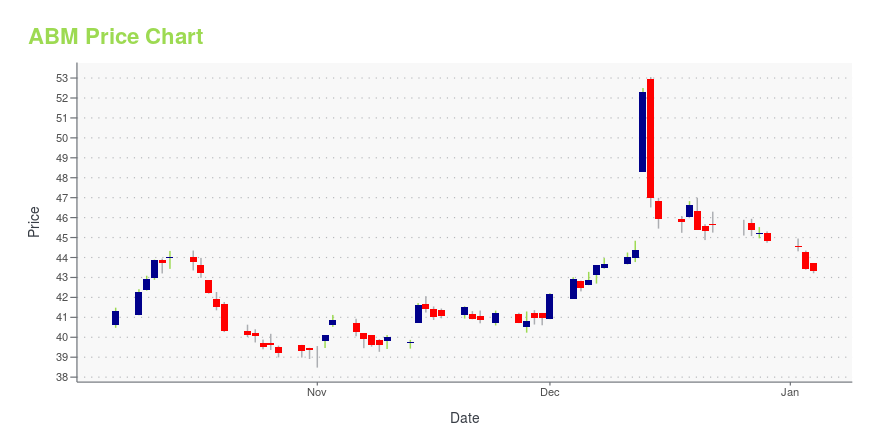
ABM Stock Price Chart Interactive Chart >
ABM POWR Grades
- ABM scores best on the Value dimension, with a Value rank ahead of 89.77% of US stocks.
- ABM's strongest trending metric is Growth; it's been moving up over the last 177 days.
- ABM ranks lowest in Sentiment; there it ranks in the 7th percentile.
ABM Stock Summary
- ABM INDUSTRIES INC's capital turnover -- a measure of revenue relative to shareholder's equity -- is better than 88.66% of US listed stocks.
- ABM INDUSTRIES INC's stock had its IPO on January 1, 1986, making it an older stock than 93.16% of US equities in our set.
- In terms of volatility of its share price, ABM is more volatile than merely 7.46% of stocks we're observing.
- Stocks that are quantitatively similar to ABM, based on their financial statements, market capitalization, and price volatility, are TKR, ATKR, MMS, PATK, and THR.
- ABM's SEC filings can be seen here. And to visit ABM INDUSTRIES INC's official web site, go to www.abm.com.
ABM Valuation Summary
- ABM's EV/EBIT ratio is 10.4; this is 33.76% lower than that of the median Industrials stock.
- Over the past 243 months, ABM's EV/EBIT ratio has gone down 1.3.
Below are key valuation metrics over time for ABM.
Stock | Date | P/S | P/B | P/E | EV/EBIT |
---|---|---|---|---|---|
ABM | 2023-09-19 | 0.3 | 1.4 | 11.2 | 10.4 |
ABM | 2023-09-18 | 0.3 | 1.4 | 11.3 | 10.4 |
ABM | 2023-09-15 | 0.3 | 1.4 | 11.2 | 10.4 |
ABM | 2023-09-14 | 0.3 | 1.5 | 11.4 | 10.6 |
ABM | 2023-09-13 | 0.3 | 1.4 | 11.1 | 10.3 |
ABM | 2023-09-12 | 0.3 | 1.4 | 10.9 | 10.2 |
ABM Growth Metrics
- Its year over year price growth rate is now at -10.42%.
- Its 2 year net cashflow from operations growth rate is now at -98.33%.
- Its 3 year net cashflow from operations growth rate is now at -97.7%.

The table below shows ABM's growth in key financial areas (numbers in millions of US dollars).
Date | Revenue | Operating Cash Flow | Net Income to Common Stock |
---|---|---|---|
2022-09-30 | 7,806.6 | 20.4 | 230.4 |
2022-06-30 | 7,491 | -41.2 | 215.9 |
2022-03-31 | 7,072.7 | 5.6 | 145.4 |
2021-12-31 | 6,672.3 | 175.4 | 127.7 |
2021-09-30 | 6,228.6 | 314.3 | 126.3 |
2021-06-30 | 6,017.5 | 457.5 | 145.1 |
ABM's Quality Factors
The “Quality” component of the POWR Ratings focuses on 31 different factors of a companies fundamentals and operational strength. Here are some key insights as we drill into the specifics of these quality attributes.- ABM has a Quality Grade of C, ranking ahead of 58.2% of graded US stocks.
- ABM's asset turnover comes in at 1.579 -- ranking 52nd of 563 Business Services stocks.
- CSGP, SABR, and TNET are the stocks whose asset turnover ratios are most correlated with ABM.
The table below shows ABM's key quality metrics over time.
Period | Asset Turnover | Gross Margin | ROIC |
---|---|---|---|
2021-07-31 | 1.579 | 0.160 | 0.176 |
2021-04-30 | 1.563 | 0.158 | 0.240 |
2021-01-31 | 1.533 | 0.152 | 0.103 |
2020-10-31 | 1.558 | 0.139 | 0.058 |
2020-07-31 | 1.609 | 0.127 | 0.054 |
2020-04-30 | 1.668 | 0.118 | 0.033 |
ABM Price Target
For more insight on analysts targets of ABM, see our ABM price target page. And for a list of of all stocks sorted by upside potential based on analyst target price, see our Top Price Target page.
Average Price Target | $62.00 | Average Broker Recommendation | 1.5 (Moderate Buy) |
ABM Industries Incorporated (ABM) Company Bio
ABM Industries offers carpet cleaning and dusting, floor cleaning and finishing, furniture polishing, window washing, and other building cleaning services for educational institutions, health facilities, retail stores, shopping centers, stadiums and arenas, airports and other transportation centers, and warehouses, as well as commercial office, government, and industrial buildings. The company was founded in 1909 and is based in New York, New York.
Latest ABM News From Around the Web
Below are the latest news stories about ABM INDUSTRIES INC that investors may wish to consider to help them evaluate ABM as an investment opportunity.
Sidoti Events, LLC’s Virtual September Small-Cap ConferenceSidoti Events, LLC, an affiliate of Sidoti & Company, LLC, has released the presentation schedule and weblinks for its two-day September Small-Cap Conference taking place Wednesday and Thursday, September 20-21, 2023. The presentation schedule is subject to change. |
Why ABM Industries Wasn't a Winning Stock This WeekThe company delivered an earnings miss and guidance that didn't meet analysts' expectations. |
ABM Industries (ABM) Q3 Earnings Miss Estimates, Revenues BeatABM Industries' (ABM) revenues increase year over year supported by organic growth and acquisitions. |
Should Value Investors Buy ABM Industries (ABM) Stock?Here at Zacks, our focus is on the proven Zacks Rank system, which emphasizes earnings estimates and estimate revisions to find great stocks. Nevertheless, we are always paying attention to the latest value, growth, and momentum trends to underscore strong picks. |
ABM Industries Incorporated (NYSE:ABM) Q3 2023 Earnings Call TranscriptABM Industries Incorporated (NYSE:ABM) Q3 2023 Earnings Call Transcript September 7, 2023 ABM Industries Incorporated misses on earnings expectations. Reported EPS is $0.79 EPS, expectations were $0.88. Operator: Greetings and welcome to the ABM Industries Inc. Third Quarter 2023 Earnings Conference Call. At this time, all participants are in a listen-only mode. A brief question-and-answer […] |
ABM Price Returns
1-mo | -13.48% |
3-mo | -6.98% |
6-mo | -11.27% |
1-year | 3.31% |
3-year | 11.37% |
5-year | 35.04% |
YTD | -9.79% |
2022 | 10.73% |
2021 | 9.81% |
2020 | 2.14% |
2019 | 20.39% |
2018 | -13.05% |
ABM Dividends
Ex-Dividend Date | Type | Payout Amount | Change | ||||||
---|---|---|---|---|---|---|---|---|---|
Loading, please wait... |
Continue Researching ABM
Here are a few links from around the web to help you further your research on Abm Industries Inc's stock as an investment opportunity:Abm Industries Inc (ABM) Stock Price | Nasdaq
Abm Industries Inc (ABM) Stock Quote, History and News - Yahoo Finance
Abm Industries Inc (ABM) Stock Price and Basic Information | MarketWatch
Loading social stream, please wait...