AECOM (ACM): Price and Financial Metrics

AECOM (ACM): $76.81

-0.25 (-0.32%)

POWR Rating

Component Grades

Momentum

C

Stability

C

Sentiment

Quality

C

Add ACM to Watchlist
Sign Up

Industry: Industrial - Services

Industry

B

Ranked

#38 of 80

in industry

ACM Price/Volume Stats
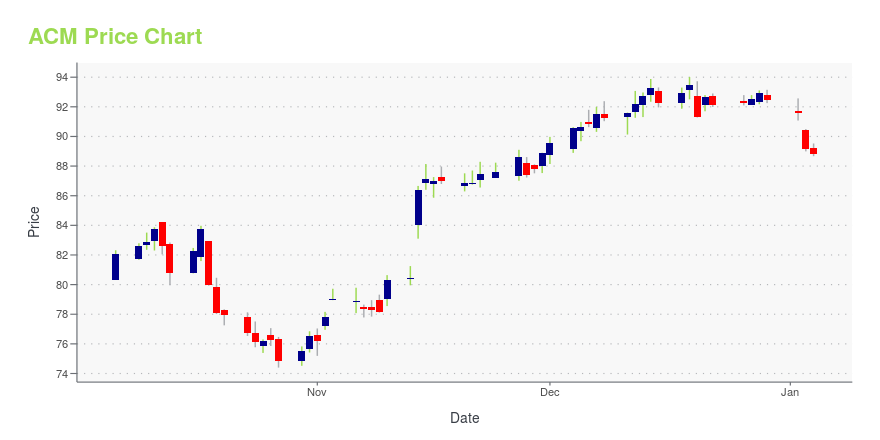
Current price $76.81 52-week high $92.16
Prev. close $77.06 52-week low $60.74
Day low $76.30 Volume 769,800
Day high $77.85 Avg. volume 984,526
50-day MA $81.25 Dividend yield 0.93%
200-day MA $80.46 Market Cap 10.68B

ACM Stock Price Chart Interactive Chart >

ACM POWR Grades

  • ACM scores best on the Growth dimension, with a Growth rank ahead of 88.54% of US stocks.
  • The strongest trend for ACM is in Quality, which has been heading down over the past 179 days.
  • ACM ranks lowest in Value; there it ranks in the 34th percentile.

ACM Stock Summary

  • With a market capitalization of $10,647,306,931, AECOM has a greater market value than 85.01% of US stocks.
  • The capital turnover (annual revenue relative to shareholder's equity) for ACM is 5.22 -- better than 91.29% of US stocks.
  • For ACM, its debt to operating expenses ratio is greater than that reported by 94.41% of US equities we're observing.
  • Stocks that are quantitatively similar to ACM, based on their financial statements, market capitalization, and price volatility, are ERO, ARIS, CHDN, WH, and OMC.
  • ACM's SEC filings can be seen here. And to visit AECOM's official web site, go to www.aecom.com.

ACM Valuation Summary

  • ACM's EV/EBIT ratio is 19.4; this is 23.57% higher than that of the median Industrials stock.
  • ACM's EV/EBIT ratio has moved up 5.1 over the prior 195 months.

Below are key valuation metrics over time for ACM.

Stock Date P/S P/B P/E EV/EBIT
ACM 2023-05-19 0.8 4.2 29.6 19.4
ACM 2023-05-18 0.8 4.3 29.8 19.6
ACM 2023-05-17 0.8 4.3 29.8 19.6
ACM 2023-05-16 0.8 4.2 29.3 19.3
ACM 2023-05-15 0.8 4.3 29.7 19.5
ACM 2023-05-12 0.8 4.2 29.2 19.2

ACM Growth Metrics

    Its year over year revenue growth rate is now at -0.71%.
  • Its 3 year cash and equivalents growth rate is now at 16.71%.
  • The 5 year price growth rate now stands at 6.4%.
ACM's revenue has moved down $4,369,243,000 over the prior 67 months.

The table below shows ACM's growth in key financial areas (numbers in millions of US dollars).

Date Revenue Operating Cash Flow Net Income to Common Stock
2022-09-30 13,148.18 713.636 310.611
2022-06-30 13,075.84 716.15 301.16
2022-03-31 13,242.5 831.644 210.803
2021-12-31 13,294.41 892.421 208.605
2021-09-30 13,340.85 704.67 173.185
2021-06-30 13,556.03 1,035.94 -153.169

ACM's Quality Factors

The “Quality” component of the POWR Ratings focuses on 31 different factors of a companies fundamentals and operational strength. Here are some key insights as we drill into the specifics of these quality attributes.
  • ACM has a Quality Grade of C, ranking ahead of 55.09% of graded US stocks.
  • ACM's asset turnover comes in at 1.097 -- ranking 113th of 563 Business Services stocks.
  • MA, BGSF, and SNPS are the stocks whose asset turnover ratios are most correlated with ACM.

The table below shows ACM's key quality metrics over time.

Period Asset Turnover Gross Margin ROIC
2021-06-30 1.097 0.057 0.036
2021-03-31 1.056 0.057 0.029
2020-12-31 1.031 0.055 0.001
2020-09-30 0.974 0.054 0.003
2020-06-30 1.059 0.051 -0.042
2020-03-31 1.151 0.047 -0.032

ACM Price Target

For more insight on analysts targets of ACM, see our ACM price target page. And for a list of of all stocks sorted by upside potential based on analyst target price, see our Top Price Target page.

Average Price Target $76.56 Average Broker Recommendation 1.3 (Strong Buy)

AECOM (ACM) Company Bio


AECOM engages in designing, building, financing, and operating infrastructure assets worldwide. The company operates through three segments: Design and Consulting Services (DCS), Construction Services (CS), and Management Services (MS). The company was founded in 1980 and is based in Los Angeles, California.


ACM Latest News Stream


Event/Time News Detail
Loading, please wait...

ACM Latest Social Stream


Loading social stream, please wait...

View Full ACM Social Stream

Latest ACM News From Around the Web

Below are the latest news stories about AECOM that investors may wish to consider to help them evaluate ACM as an investment opportunity.

AECOM's (ACM) JV Wins USACE Deal, Aids Environment Business

AECOM's (ACM) recent deal is in line with its Sustainable Legacies' strategy.

Yahoo | May 12, 2023

KBR to Implement ROSE Technology at HPCL's Mumbai Refinery

KBR's focus on achieving zero carbon emissions and developing more sustainable technologies is encouraging.

Yahoo | May 11, 2023

AECOM to conduct PFAS investigation and remediation for U.S. Army National Guard facilities nationwide

DALLAS, May 11, 2023--AECOM (NYSE: ACM), the world’s trusted infrastructure consulting firm, announced today that its joint venture was awarded a contract from the U.S. Army Corps of Engineers (USACE) to deliver per-and polyfluoroalkyl substances (PFAS) remedial investigations, feasibility studies, removal actions, and associated work at Army National Guard (ARNG) facilities nationwide. This work builds on AECOM’s prior experience executing extensive preliminary PFAS investigations at ARNG facil

Yahoo | May 11, 2023

We Ran A Stock Scan For Earnings Growth And AECOM (NYSE:ACM) Passed With Ease

Investors are often guided by the idea of discovering 'the next big thing', even if that means buying 'story stocks...

Yahoo | May 10, 2023

AECOM joint venture to provide detailed design for Western Harbour Tunnel

DALLAS, May 10, 2023--AECOM (NYSE: ACM), the world’s trusted infrastructure consulting firm, today announced that its joint venture with Aurecon has been awarded a contract by Acciona Construction Australia for the detailed design of the Western Harbour Tunnel, which will create a bypass of the Sydney central business district.

Yahoo | May 10, 2023

Read More 'ACM' Stories Here

ACM Price Returns

1-mo -7.51%
3-mo -12.42%
6-mo -9.26%
1-year N/A
3-year 100.63%
5-year 135.71%
YTD -9.18%
2022 10.72%
2021 55.38%
2020 15.42%
2019 62.75%
2018 -28.67%

ACM Dividends

Ex-Dividend Date Type Payout Amount Change
Loading, please wait...
View Full ACM Dividend History

Continue Researching ACM

Want to see what other sources are saying about Aecom's financials and stock price? Try the links below:

Aecom (ACM) Stock Price | Nasdaq
Aecom (ACM) Stock Quote, History and News - Yahoo Finance
Aecom (ACM) Stock Price and Basic Information | MarketWatch

Get Free Updates

Join thousands of investors who get the latest news, insights and top rated picks from StockNews.com!