Acacia Research Corporation (ACTG): Price and Financial Metrics
GET POWR RATINGS... FREE!
ACTG POWR Grades
- Sentiment is the dimension where ACTG ranks best; there it ranks ahead of 63.67% of US stocks.
- The strongest trend for ACTG is in Growth, which has been heading up over the past 177 days.
- ACTG's current lowest rank is in the Quality metric (where it is better than 7.44% of US stocks).
ACTG Stock Summary
- With a year-over-year growth in debt of -66%, ACACIA RESEARCH CORP's debt growth rate surpasses merely 3.42% of about US stocks.
- Revenue growth over the past 12 months for ACACIA RESEARCH CORP comes in at -32.74%, a number that bests merely 6.2% of the US stocks we're tracking.
- ACACIA RESEARCH CORP's shareholder yield -- a measure of how much capital is returned to stockholders via dividends and buybacks -- is 76.62%, greater than the shareholder yield of 97.49% of stocks in our set.
- Stocks that are quantitatively similar to ACTG, based on their financial statements, market capitalization, and price volatility, are AMS, NVFY, ORGS, VINP, and XTNT.
- Visit ACTG's SEC page to see the company's official filings. To visit the company's web site, go to www.acaciaresearch.com.
ACTG Valuation Summary
- ACTG's EV/EBIT ratio is -0.2; this is 101.28% lower than that of the median Industrials stock.
- ACTG's price/sales ratio has moved down 7.7 over the prior 243 months.
Below are key valuation metrics over time for ACTG.
Stock | Date | P/S | P/B | P/E | EV/EBIT |
---|---|---|---|---|---|
ACTG | 2023-03-17 | 4.2 | 1.0 | -1.8 | -0.2 |
ACTG | 2023-03-16 | 1.8 | 0.7 | 3.2 | 0.1 |
ACTG | 2023-03-15 | 1.8 | 0.8 | 3.3 | 0.2 |
ACTG | 2023-03-14 | 1.8 | 0.8 | 3.3 | 0.2 |
ACTG | 2023-03-13 | 1.8 | 0.7 | 3.2 | 0.1 |
ACTG | 2023-03-10 | 1.8 | 0.8 | 3.3 | 0.2 |
ACTG Growth Metrics
- Its 5 year net cashflow from operations growth rate is now at 147.1%.
- The 4 year revenue growth rate now stands at -91.47%.
- Its 2 year net income to common stockholders growth rate is now at 856.58%.

The table below shows ACTG's growth in key financial areas (numbers in millions of US dollars).
Date | Revenue | Operating Cash Flow | Net Income to Common Stock |
---|---|---|---|
2022-09-30 | 109.364 | 7.33 | 59.885 |
2022-06-30 | 95.068 | 1.97 | 112.282 |
2022-03-31 | 95.751 | 16.283 | 190.833 |
2021-12-31 | 88.047 | 13.326 | 118.804 |
2021-09-30 | 29.168 | -32.771 | 16.919 |
2021-06-30 | 47.052 | -18.674 | -25.536 |
ACTG's Quality Factors
The “Quality” component of the POWR Ratings focuses on 31 different factors of a companies fundamentals and operational strength. Here are some key insights as we drill into the specifics of these quality attributes.- ACTG has a Quality Grade of C, ranking ahead of 32.87% of graded US stocks.
- ACTG's asset turnover comes in at 0.088 -- ranking 241st of 444 Trading stocks.
- TPL, TCI, and NXRT are the stocks whose asset turnover ratios are most correlated with ACTG.
The table below shows ACTG's key quality metrics over time.
Period | Asset Turnover | Gross Margin | ROIC |
---|---|---|---|
2021-06-30 | 0.088 | 0.337 | -0.055 |
2021-03-31 | 0.067 | 0.242 | -0.117 |
2020-12-31 | 0.077 | 0.313 | 0.536 |
2020-09-30 | 0.083 | 0.289 | 0.192 |
2020-06-30 | 0.033 | 0.164 | -0.103 |
2020-03-31 | 0.057 | 0.169 | -0.226 |
ACTG Price Target
For more insight on analysts targets of ACTG, see our ACTG price target page. And for a list of of all stocks sorted by upside potential based on analyst target price, see our Top Price Target page.
Average Price Target | $8.00 | Average Broker Recommendation | 1.5 (Moderate Buy) |
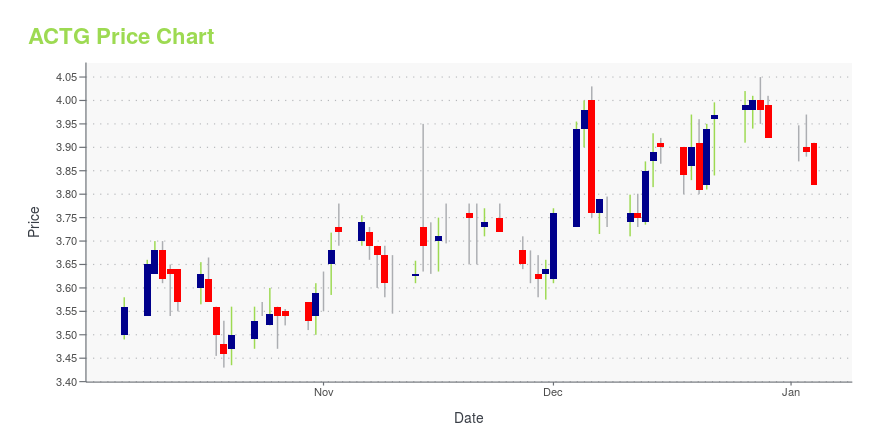
ACTG Stock Price Chart Interactive Chart >
ACTG Price/Volume Stats
Current price | $3.88 | 52-week high | $5.30 |
Prev. close | $3.85 | 52-week low | $3.43 |
Day low | $3.77 | Volume | 221,300 |
Day high | $3.93 | Avg. volume | 233,225 |
50-day MA | $4.26 | Dividend yield | N/A |
200-day MA | $4.29 | Market Cap | 227.25M |
Acacia Research Corporation (ACTG) Company Bio
Acacia Research Corporation, through its subsidiaries, invests in, develops, licenses, and enforces patented technologies in the United States. The company was founded in 1992 and is based in Newport Beach, California.
Latest ACTG News From Around the Web
Below are the latest news stories about ACACIA RESEARCH CORP that investors may wish to consider to help them evaluate ACTG as an investment opportunity.
Acacia Research Corporation (NASDAQ:ACTG) Q4 2022 Earnings Call TranscriptAcacia Research Corporation (NASDAQ:ACTG) Q4 2022 Earnings Call Transcript March 16, 2023 Operator: Greetings. Welcome to the Acacia Research Fourth Quarter 2022 Financial Results. At this time, all participants are in a listen-only mode. A question-and-answer session will follow the formal presentation. Please note this conference is being recorded. I will now turn the conference […] |
Q4 2022 Acacia Research Corp Earnings CallQ4 2022 Acacia Research Corp Earnings Call |
Acacia Research: Q4 Earnings SnapshotNEW YORK (AP) — Acacia Research Corp. (ACTG) on Thursday reported a fourth-quarter loss of $18.4 million, after reporting a profit in the same period a year earlier. This story was generated by Automated Insights (http://automatedinsights.com/ap) using data from Zacks Investment Research. |
Acacia Research Reports Fourth Quarter and Full-Year 2022 Financial ResultsNEW YORK, March 16, 2023--Acacia Research Corporation (Nasdaq: ACTG) ("Acacia" or the "Company") today reported financial results for the three months and full year ended December 31, 2022. |
What's Happening Deep in the Heart of Deep Value Land?The view from net/net land (companies trading below net current asset value or NCAV) is downright depressing these days. This Ben Graham-inspired deep-value screen, which at times has revealed dozens of potential "cigar butts with one last puff," and perhaps a handful of diamonds in the rough, is not showing much at all these days. Near the top of the list in terms of market cap, however, is construction name Tutor Perini . |
ACTG Price Returns
1-mo | -10.80% |
3-mo | -7.84% |
6-mo | -3.96% |
1-year | -13.97% |
3-year | 74.77% |
5-year | 10.86% |
YTD | -7.84% |
2022 | -17.93% |
2021 | 30.20% |
2020 | 48.12% |
2019 | -10.74% |
2018 | -26.42% |
Continue Researching ACTG
Want to see what other sources are saying about Acacia Research Corp's financials and stock price? Try the links below:Acacia Research Corp (ACTG) Stock Price | Nasdaq
Acacia Research Corp (ACTG) Stock Quote, History and News - Yahoo Finance
Acacia Research Corp (ACTG) Stock Price and Basic Information | MarketWatch
Loading social stream, please wait...