Aeva Technologies, Inc., (AEVA): Price and Financial Metrics
GET POWR RATINGS... FREE!
AEVA POWR Grades
- AEVA scores best on the Sentiment dimension, with a Sentiment rank ahead of 72.26% of US stocks.
- The strongest trend for AEVA is in Growth, which has been heading up over the past 179 days.
- AEVA's current lowest rank is in the Quality metric (where it is better than 3.5% of US stocks).
AEVA Stock Summary
- AEVA's one year PEG ratio, measuring expected growth in earnings next year relative to current common stock price is 0.43 -- higher than merely 4.95% of US-listed equities with positive expected earnings growth.
- With a price/sales ratio of 44.74, AEVA TECHNOLOGIES INC has a higher such ratio than 96.21% of stocks in our set.
- AEVA's equity multiplier -- a measure of assets relative to shareholders'equity -- is greater than that of only 6.83% of US stocks.
- Stocks that are quantitatively similar to AEVA, based on their financial statements, market capitalization, and price volatility, are ACET, PRTA, CCCC, RCUS, and ONCT.
- AEVA's SEC filings can be seen here. And to visit AEVA TECHNOLOGIES INC's official web site, go to www.aeva.ai.
AEVA Valuation Summary
- AEVA's EV/EBIT ratio is -1.8; this is 113.85% lower than that of the median Consumer Cyclical stock.
- AEVA's EV/EBIT ratio has moved up 9.9 over the prior 38 months.
Below are key valuation metrics over time for AEVA.
Stock | Date | P/S | P/B | P/E | EV/EBIT |
---|---|---|---|---|---|
AEVA | 2023-03-17 | 52.0 | 1.0 | -2.6 | -1.8 |
AEVA | 2023-03-16 | 51.7 | 1.0 | -2.6 | -1.8 |
AEVA | 2023-03-15 | 51.4 | 1.0 | -2.6 | -1.8 |
AEVA | 2023-03-14 | 52.7 | 1.0 | -2.7 | -1.8 |
AEVA | 2023-03-13 | 53.9 | 1.0 | -2.7 | -1.9 |
AEVA | 2023-03-10 | 50.1 | 0.9 | -2.5 | -1.7 |
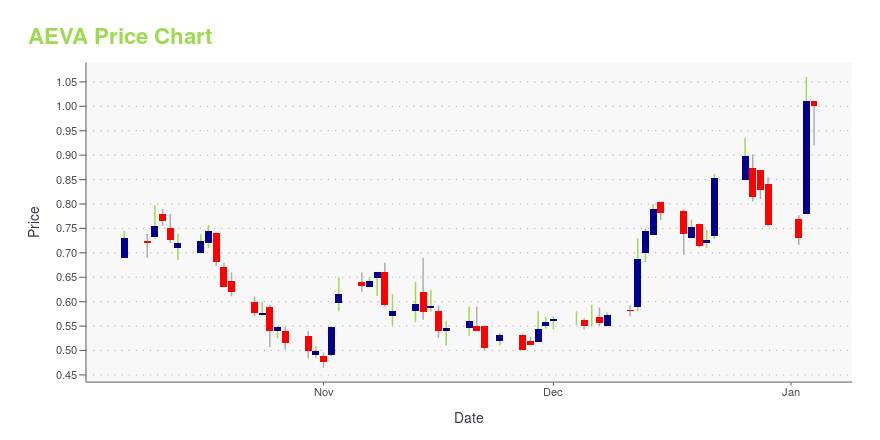
AEVA Stock Price Chart Interactive Chart >
AEVA Price/Volume Stats
Current price | $1.18 | 52-week high | $4.64 |
Prev. close | $1.42 | 52-week low | $1.17 |
Day low | $1.17 | Volume | 3,189,100 |
Day high | $1.41 | Avg. volume | 1,241,177 |
50-day MA | $1.69 | Dividend yield | N/A |
200-day MA | $2.28 | Market Cap | 257.51M |
Aeva Technologies, Inc., (AEVA) Company Bio
AEVA, INC. operates as a machine vision company engages in development of optical-based sensors for the automotive industry. It builds lidar, a laser guidance sensor that are expected to be a key component of self-driving vehicles. The company was incorporated in 2016 and is based in Palo Alto, California.
Latest AEVA News From Around the Web
Below are the latest news stories about AEVA TECHNOLOGIES INC that investors may wish to consider to help them evaluate AEVA as an investment opportunity.
Q4 2022 Aeva Technologies Inc Earnings CallQ4 2022 Aeva Technologies Inc Earnings Call |
Aeva Technologies, Inc. (AEVA) Reports Q4 Loss, Misses Revenue EstimatesAeva Technologies, Inc. (AEVA) delivered earnings and revenue surprises of -6.25% and 94.08%, respectively, for the quarter ended December 2022. Do the numbers hold clues to what lies ahead for the stock? |
Aeva Reports Fourth Quarter and Full Year 2022 ResultsMOUNTAIN VIEW, Calif., March 22, 2023--Aeva® (NYSE: AEVA), a leader in next-generation sensing and perception systems, today announced its fourth quarter and full year 2022 results. |
Aeva Technologies (NYSE:AEVA) investors are sitting on a loss of 84% if they invested three years agoWhile not a mind-blowing move, it is good to see that the Aeva Technologies, Inc. ( NYSE:AEVA ) share price has gained... |
Aeva Announces Date for Fourth Quarter and Full Year 2022 Results and Conference CallMOUNTAIN VIEW, Calif., February 23, 2023--Aeva® (NYSE: AEVA), a leader in next-generation sensing and perception systems, today announced that it will report results for the fourth quarter and full year 2022 after market close on Wednesday, March 22, 2023. Aeva will host a conference call and webcast to discuss the fourth quarter and full year 2022 results at 2:00 p.m. Pacific Time (5:00 p.m. Eastern Time) on the same day. |
AEVA Price Returns
1-mo | -25.79% |
3-mo | -3.28% |
6-mo | -43.81% |
1-year | -72.56% |
3-year | -87.41% |
5-year | N/A |
YTD | -13.24% |
2022 | -82.01% |
2021 | -48.01% |
2020 | N/A |
2019 | N/A |
2018 | N/A |
Loading social stream, please wait...