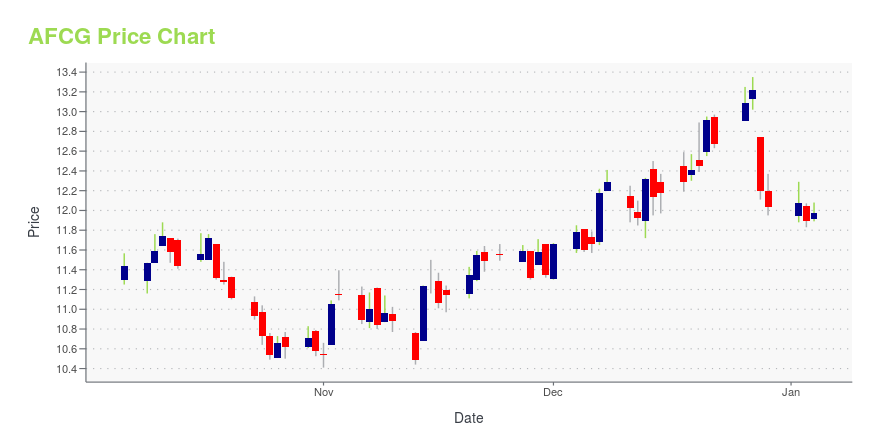
AFC Gamma, Inc. (AFCG): Price and Financial Metrics
AFCG Price/Volume Stats
| Current price | $6.09 | 52-week high | $12.74 |
| Prev. close | $6.29 | 52-week low | $6.07 |
| Day low | $6.07 | Volume | 298,000 |
| Day high | $6.38 | Avg. volume | 214,108 |
| 50-day MA | $7.92 | Dividend yield | 20.99% |
| 200-day MA | $9.43 | Market Cap | 137.61M |
AFCG Stock Price Chart Interactive Chart >
AFC Gamma, Inc. (AFCG) Company Bio
AFC Gamma, Inc. originates, structures, underwrites, and manages senior secured loans and other types of loans for established companies operating in the cannabis industry in states that have legalized medicinal and/or adult use cannabis. It primarily originates loans structured as senior loans secured by real estate, equipment, licenses and/or other assets of the loan parties to the extent permitted by applicable laws and the regulations governing such loan parties. AFC Gamma, Inc. has elected and qualified to be taxed as a real estate investment trust for the United States federal income tax purposes under the Internal Revenue Code of 1986. The company was founded in 2020 and is based in West Palm Beach, Florida
AFCG Price Returns
| 1-mo | -28.60% |
| 3-mo | -26.09% |
| 6-mo | -36.53% |
| 1-year | N/A |
| 3-year | -29.11% |
| 5-year | N/A |
| YTD | -26.89% |
| 2024 | 18.70% |
| 2023 | -10.49% |
| 2022 | -21.23% |
| 2021 | N/A |
| 2020 | N/A |
AFCG Dividends
| Ex-Dividend Date | Type | Payout Amount | Change | ||||||
|---|---|---|---|---|---|---|---|---|---|
| Loading, please wait... | |||||||||


Loading social stream, please wait...