
PlayAGS, Inc. (AGS): Price and Financial Metrics
AGS Price/Volume Stats
| Current price | $11.43 | 52-week high | $11.75 |
| Prev. close | $11.40 | 52-week low | $6.27 |
| Day low | $11.43 | Volume | 191,287 |
| Day high | $11.50 | Avg. volume | 421,850 |
| 50-day MA | $11.49 | Dividend yield | N/A |
| 200-day MA | $9.14 | Market Cap | 450.97M |
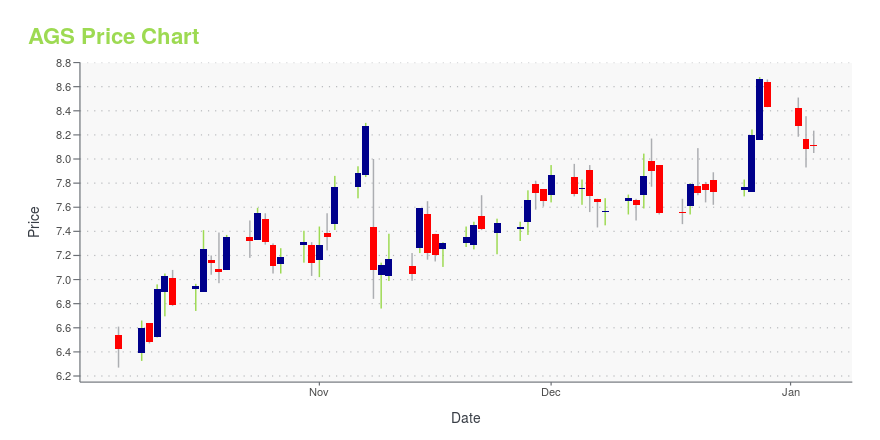
AGS Stock Price Chart Interactive Chart >
PlayAGS, Inc. (AGS) Company Bio
PlayAGS, Inc. designs and supplies products and services for the gaming industry in the United States. It offers electronic gaming machines, such as slot machines, video bingo machines, and other electronic gaming devices; and server-based systems and back-office systems that are used by casinos and other gaming locations. The company also provides table products, such as live proprietary table games and side bets, as well as ancillary table products; and interactive products, such as social casino games to play on mobile devices. It serves casino operators in class II and class III Native American and commercial gaming enterprises. The company was formerly known as AP Gaming Holdco, Inc. and changed its name to PlayAGS, Inc. in December 2017. PlayAGS, Inc. was founded in 2005 and is based in Las Vegas, Nevada.
Latest AGS News From Around the Web
Below are the latest news stories about PLAYAGS INC that investors may wish to consider to help them evaluate AGS as an investment opportunity.
Getting In Cheap On PlayAGS, Inc. (NYSE:AGS) Is UnlikelyWith a median price-to-sales (or "P/S") ratio of close to 1.3x in the Hospitality industry in the United States, you... |
AGS Partners With Three Rivers Resort to Deliver An AGS-Exclusive Table Games FloorThe Property Also Serves as a Launch Site for the Nation’s First Bonus Spin Xtreme for Craps Bonus Spin Xtreme at Three Rivers Casino Bonus Spin Xtreme at Three Rivers Casino LAS VEGAS, Dec. 13, 2023 (GLOBE NEWSWIRE) -- Three Rivers Casino Resort in Florence, Oregon upgraded its casino floor last month to exclusively utilize AGS table products. Included in the installation are 12 of AGS’ award-winning progressive systems Bonus Spin™ Xtreme, which links all table games on the floor to form a sing |
GameStop and Becton, Dickinson and Company have been highlighted as Zacks Bull and Bear of the DayGameStop and Becton, Dickinson and Company are part of the Zacks Bull and Bear of the Day article. |
3 Industry-Beating Casino Stocks to Watch Amid Market VolatilityThe casino industry continues to show resilience backed by sustained customer engagement efforts and property investments. RRR, PENN and AGS have surged in the past three months. |
Should We Be Cautious About PlayAGS, Inc.'s (NYSE:AGS) ROE Of 4.6%?One of the best investments we can make is in our own knowledge and skill set. With that in mind, this article will... |
AGS Price Returns
| 1-mo | 0.18% |
| 3-mo | 28.28% |
| 6-mo | 38.21% |
| 1-year | 76.39% |
| 3-year | 49.80% |
| 5-year | -39.65% |
| YTD | 35.59% |
| 2023 | 65.29% |
| 2022 | -24.89% |
| 2021 | -5.69% |
| 2020 | -40.64% |
| 2019 | -47.26% |
Continue Researching AGS
Want to do more research on PlayAGS Inc's stock and its price? Try the links below:PlayAGS Inc (AGS) Stock Price | Nasdaq
PlayAGS Inc (AGS) Stock Quote, History and News - Yahoo Finance
PlayAGS Inc (AGS) Stock Price and Basic Information | MarketWatch
Loading social stream, please wait...