Assurant Inc. (AIZ): Price and Financial Metrics
AIZ Price/Volume Stats
Current price | $178.39 | 52-week high | $183.13 |
Prev. close | $181.16 | 52-week low | $106.07 |
Day low | $178.00 | Volume | 290,000 |
Day high | $181.46 | Avg. volume | 372,198 |
50-day MA | $173.15 | Dividend yield | 1.6% |
200-day MA | $152.34 | Market Cap | 9.27B |
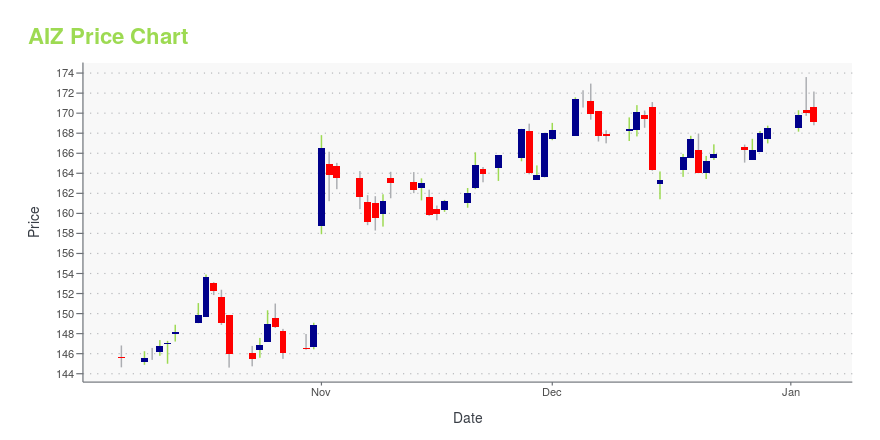
AIZ Stock Price Chart Interactive Chart >
AIZ POWR Grades
- Growth is the dimension where AIZ ranks best; there it ranks ahead of 97.9% of US stocks.
- The strongest trend for AIZ is in Value, which has been heading down over the past 26 weeks.
- AIZ's current lowest rank is in the Value metric (where it is better than 46.71% of US stocks).
AIZ Stock Summary
- Of note is the ratio of ASSURANT INC's sales and general administrative expense to its total operating expenses; 87.04% of US stocks have a lower such ratio.
- Equity multiplier, or assets relative to shareholders' equity, comes in at 7.52 for ASSURANT INC; that's greater than it is for 84.96% of US stocks.
- Over the past twelve months, AIZ has reported earnings growth of 52.42%, putting it ahead of 82.62% of US stocks in our set.
- Stocks that are quantitatively similar to AIZ, based on their financial statements, market capitalization, and price volatility, are SIGI, ORI, AAP, L, and UVE.
- AIZ's SEC filings can be seen here. And to visit ASSURANT INC's official web site, go to www.assurant.com.
AIZ Valuation Summary
- AIZ's price/earnings ratio is 16.5; this is 50% higher than that of the median Financial Services stock.
- Over the past 242 months, AIZ's price/sales ratio has gone up 0.3.
Below are key valuation metrics over time for AIZ.
Stock | Date | P/S | P/B | P/E | EV/EBIT |
---|---|---|---|---|---|
AIZ | 2023-12-22 | 0.8 | 1.9 | 16.5 | 11.9 |
AIZ | 2023-12-21 | 0.8 | 1.9 | 16.4 | 11.9 |
AIZ | 2023-12-20 | 0.8 | 1.9 | 16.3 | 11.8 |
AIZ | 2023-12-19 | 0.8 | 2.0 | 16.7 | 12.0 |
AIZ | 2023-12-18 | 0.8 | 1.9 | 16.5 | 11.9 |
AIZ | 2023-12-15 | 0.8 | 1.9 | 16.3 | 11.8 |
AIZ Growth Metrics
- Its 5 year cash and equivalents growth rate is now at 128.69%.
- The 2 year net cashflow from operations growth rate now stands at -32.95%.
- Its 5 year price growth rate is now at -5.43%.
The table below shows AIZ's growth in key financial areas (numbers in millions of US dollars).
Date | Revenue | Operating Cash Flow | Net Income to Common Stock |
---|---|---|---|
2022-12-31 | 10,193 | 596.9 | 276.6 |
2022-09-30 | 10,115.1 | 574.5 | 328.6 |
2022-06-30 | 10,205.1 | -75.4 | 1,203.7 |
2022-03-31 | 10,237.7 | 699.3 | 1,354.9 |
2021-12-31 | 10,187.6 | 781.7 | 1,367.7 |
2021-09-30 | 10,167.8 | 967.4 | 1,378.6 |
AIZ's Quality Factors
The “Quality” component of the POWR Ratings focuses on 31 different factors of a companies fundamentals and operational strength. Here are some key insights as we drill into the specifics of these quality attributes.- AIZ has a Quality Grade of C, ranking ahead of 61.75% of graded US stocks.
- AIZ's asset turnover comes in at 0.241 -- ranking 74th of 133 Insurance stocks.
- MOH, MMC, and GLRE are the stocks whose asset turnover ratios are most correlated with AIZ.
The table below shows AIZ's key quality metrics over time.
Period | Asset Turnover | Gross Margin | ROIC |
---|---|---|---|
2021-09-30 | 0.241 | 0.772 | 0.043 |
2021-06-30 | 0.225 | 0.759 | 0.018 |
2021-03-31 | 0.225 | 0.752 | 0.018 |
2020-12-31 | 0.230 | 0.747 | 0.015 |
2020-09-30 | 0.231 | 0.748 | 0.015 |
2020-06-30 | 0.231 | 0.748 | 0.014 |
AIZ Price Target
For more insight on analysts targets of AIZ, see our AIZ price target page. And for a list of of all stocks sorted by upside potential based on analyst target price, see our Top Price Target page.
Average Price Target | $190.80 | Average Broker Recommendation | 1.31 (Strong Buy) |
Assurant Inc. (AIZ) Company Bio
Assurant, Inc. is a global provider of risk management products and services with headquarters in New York City. Its businesses provide a diverse set of specialty, niche-market insurance products in the property, casualty, extended device protection, and preneed insurance sectors. The company’s main operating segments are Global Housing and Global Lifestyle. (Source:Wikipedia)
Latest AIZ News From Around the Web
Below are the latest news stories about ASSURANT INC that investors may wish to consider to help them evaluate AIZ as an investment opportunity.
3 Insurance Stocks That Have Outperformed the S&P 500 YTDInsurers Assurant (AIZ), Kinsale Capital (KNSL) and NMI Holdings (NMIH) outperform the industry, the sector and the S&P 500 composite and look poised to retain the rally. |
AIZ vs. GSHD: Which Stock Is the Better Value Option?AIZ vs. GSHD: Which Stock Is the Better Value Option? |
Is Assurant (AIZ) Stock Outpacing Its Finance Peers This Year?Here is how Assurant (AIZ) and Enact Holdings, Inc. (ACT) have performed compared to their sector so far this year. |
Why You Should Add RenaissanceRe (RNR) Stock to Your PortfolioAn improvement in the top line led by higher premiums and net investment income poises RenaissanceRe (RNR) well for growth. |
Here's Why Assurant (AIZ) Stock is Investors' Favorite NowAssurant (AIZ) appears poised for growth on a well-performing Global Lifestyle business, growth of fee-based capital-light businesses and solid capital management. |
AIZ Price Returns
1-mo | 2.69% |
3-mo | 9.19% |
6-mo | 25.80% |
1-year | 63.56% |
3-year | 31.10% |
5-year | 104.87% |
YTD | 6.33% |
2023 | 37.52% |
2022 | -18.34% |
2021 | 16.46% |
2020 | 6.09% |
2019 | 49.78% |
AIZ Dividends
Ex-Dividend Date | Type | Payout Amount | Change | ||||||
---|---|---|---|---|---|---|---|---|---|
Loading, please wait... |
Continue Researching AIZ
Want to do more research on Assurant Inc's stock and its price? Try the links below:Assurant Inc (AIZ) Stock Price | Nasdaq
Assurant Inc (AIZ) Stock Quote, History and News - Yahoo Finance
Assurant Inc (AIZ) Stock Price and Basic Information | MarketWatch
Loading social stream, please wait...