
Ambac Financial Group, Inc. (AMBC): Price and Financial Metrics
AMBC Price/Volume Stats
| Current price | $12.85 | 52-week high | $18.45 |
| Prev. close | $12.67 | 52-week low | $11.26 |
| Day low | $12.69 | Volume | 353,451 |
| Day high | $12.93 | Avg. volume | 423,132 |
| 50-day MA | $14.05 | Dividend yield | N/A |
| 200-day MA | $14.82 | Market Cap | 581.14M |
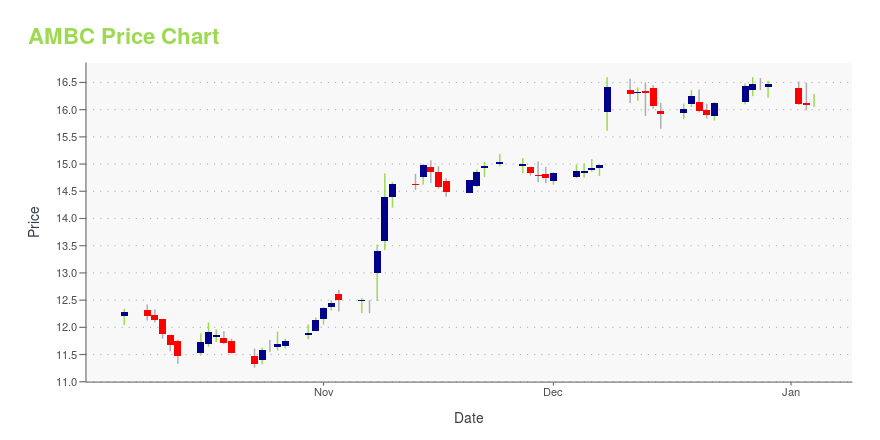
AMBC Stock Price Chart Interactive Chart >
Ambac Financial Group, Inc. (AMBC) Company Bio
Ambac Financial Group, Inc. provides financial guarantee insurance and financial management services. The company was founded in 1971 and is based in New York City, New York.
Latest AMBC News From Around the Web
Below are the latest news stories about AMBAC FINANCIAL GROUP INC that investors may wish to consider to help them evaluate AMBC as an investment opportunity.
Should Value Investors Buy Ambac (AMBC) Stock?Here at Zacks, our focus is on the proven Zacks Rank system, which emphasizes earnings estimates and estimate revisions to find great stocks. Nevertheless, we are always paying attention to the latest value, growth, and momentum trends to underscore strong picks. |
Are Investors Undervaluing Ambac (AMBC) Right Now?Here at Zacks, our focus is on the proven Zacks Rank system, which emphasizes earnings estimates and estimate revisions to find great stocks. Nevertheless, we are always paying attention to the latest value, growth, and momentum trends to underscore strong picks. |
The Zacks Analyst Blog Highlights Ambac, Pangaea Logistics Solutions, MoneyLion, OppFi and Carrols Restaurant GroupAmbac, Pangaea Logistics Solutions, MoneyLion, OppFi and Carrols Restaurant Group are part of the Zacks top Analyst Blog |
As Ambac Financial Group (NYSE:AMBC) rallies 15% this past week, investors may now be noticing the company's five-year earnings growthAmbac Financial Group, Inc. ( NYSE:AMBC ) shareholders should be happy to see the share price up 21% in the last month... |
Ambac Financial Group, Inc. (NYSE:AMBC) Q3 2023 Earnings Call TranscriptAmbac Financial Group, Inc. (NYSE:AMBC) Q3 2023 Earnings Call Transcript November 8, 2023 Operator: Ladies and gentlemen, good morning, and welcome to the Ambac Financial Group Third Quarter 2023 Earnings Conference Call. At this time, all participants are in a listen-only mode. A brief question-and-answer session will follow the formal presentation. [Operator Instructions]. As a […] |
AMBC Price Returns
| 1-mo | 2.15% |
| 3-mo | -11.93% |
| 6-mo | -21.36% |
| 1-year | -11.20% |
| 3-year | -10.83% |
| 5-year | -28.33% |
| YTD | -22.03% |
| 2023 | -5.50% |
| 2022 | 8.66% |
| 2021 | 4.36% |
| 2020 | -28.70% |
| 2019 | 25.12% |
Continue Researching AMBC
Want to see what other sources are saying about Ambac Financial Group Inc's financials and stock price? Try the links below:Ambac Financial Group Inc (AMBC) Stock Price | Nasdaq
Ambac Financial Group Inc (AMBC) Stock Quote, History and News - Yahoo Finance
Ambac Financial Group Inc (AMBC) Stock Price and Basic Information | MarketWatch
Loading social stream, please wait...