AMC Networks Inc. - (AMCX): Price and Financial Metrics

AMC Networks Inc. - (AMCX): $12.12

0.17 (-1.38%)

POWR Rating

Component Grades

Momentum

D

Stability

D

Sentiment

Quality

B

AMCX Price/Volume Stats

Current price $12.12 52-week high $20.97
Prev. close $12.29 52-week low $9.96
Day low $12.12 Volume 104,826
Day high $12.42 Avg. volume 649,544
50-day MA $14.45 Dividend yield N/A
200-day MA $13.86 Market Cap 527.97M

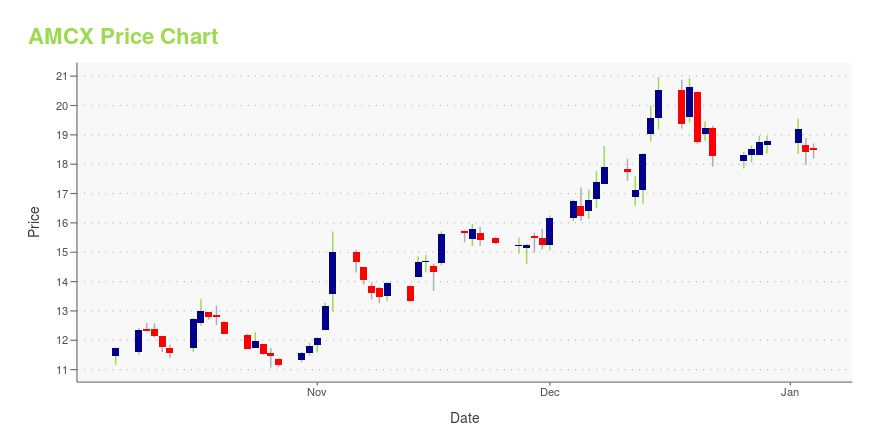
AMCX Stock Price Chart Interactive Chart >

AMCX POWR Grades

  • Quality is the dimension where AMCX ranks best; there it ranks ahead of 92.92% of US stocks.
  • The strongest trend for AMCX is in Quality, which has been heading up over the past 26 weeks.
  • AMCX's current lowest rank is in the Stability metric (where it is better than 13.66% of US stocks).

AMCX Stock Summary

  • Price to trailing twelve month operating cash flow for AMCX is currently 2.9, higher than only 9.02% of US stocks with positive operating cash flow.
  • With a price/sales ratio of 0.27, AMC NETWORKS INC has a higher such ratio than merely 8.22% of stocks in our set.
  • In terms of twelve month growth in earnings before interest and taxes, AMC NETWORKS INC is reporting a growth rate of -88.24%; that's higher than merely 15.24% of US stocks.
  • Stocks that are quantitatively similar to AMCX, based on their financial statements, market capitalization, and price volatility, are PENN, JBLU, KAR, SBT, and HAIN.
  • AMCX's SEC filings can be seen here. And to visit AMC NETWORKS INC's official web site, go to www.amcnetworks.com.

AMCX Valuation Summary

  • AMCX's price/earnings ratio is -29.9; this is 267.98% lower than that of the median Communication Services stock.
  • Over the past 153 months, AMCX's price/sales ratio has gone down 2.1.

Below are key valuation metrics over time for AMCX.

Stock Date P/S P/B P/E EV/EBIT
AMCX 2023-12-29 0.3 0.8 -29.9 44.2
AMCX 2023-12-28 0.3 0.8 -29.8 44.2
AMCX 2023-12-27 0.3 0.8 -29.4 44.0
AMCX 2023-12-26 0.3 0.8 -29.1 43.9
AMCX 2023-12-22 0.3 0.8 -29.0 43.8
AMCX 2023-12-21 0.3 0.8 -30.6 44.5

AMCX Growth Metrics

    The year over year net income to common stockholders growth rate now stands at 3.65%.
  • Its 3 year net cashflow from operations growth rate is now at -98.13%.
  • Its 2 year cash and equivalents growth rate is now at 16.69%.
AMCX's revenue has moved up $170,528,000 over the prior 52 months.

The table below shows AMCX's growth in key financial areas (numbers in millions of US dollars).

Date Revenue Operating Cash Flow Net Income to Common Stock
2022-12-31 3,096.545 181.834 7.594
2022-09-30 2,935.734 136.081 289.322
2022-06-30 3,064.657 29.481 315.307
2022-03-31 3,098.024 12.356 267.763
2021-12-31 3,077.608 143.474 250.596
2021-09-30 3,054.174 148.633 328.268

AMCX's Quality Factors

The “Quality” component of the POWR Ratings focuses on 31 different factors of a companies fundamentals and operational strength. Here are some key insights as we drill into the specifics of these quality attributes.
  • AMCX has a Quality Grade of B, ranking ahead of 92.82% of graded US stocks.
  • AMCX's asset turnover comes in at 0.543 -- ranking 15th of 64 Communication stocks.
  • TMUS, ROKU, and CMCSA are the stocks whose asset turnover ratios are most correlated with AMCX.

The table below shows AMCX's key quality metrics over time.

Period Asset Turnover Gross Margin ROIC
2021-06-30 0.543 0.519 0.136
2021-03-31 0.523 0.517 0.128
2020-12-31 0.530 0.502 0.124
2020-09-30 0.522 0.508 0.092
2020-06-30 0.528 0.512 0.094
2020-03-31 0.545 0.498 0.117

AMCX Price Target

For more insight on analysts targets of AMCX, see our AMCX price target page. And for a list of of all stocks sorted by upside potential based on analyst target price, see our Top Price Target page.

Average Price Target $51.51 Average Broker Recommendation 2.12 (Hold)

AMC Networks Inc. - (AMCX) Company Bio


AMC Networks owns and operates various cable television’s brands delivering content to audiences, and a platform to distributors and advertisers in the United States and internationally. The company was founded in 1980 and is based in New York, New York.


AMCX Latest News Stream


Event/Time News Detail
Loading, please wait...

AMCX Latest Social Stream


Loading social stream, please wait...

View Full AMCX Social Stream

Latest AMCX News From Around the Web

Below are the latest news stories about AMC NETWORKS INC that investors may wish to consider to help them evaluate AMCX as an investment opportunity.

Is Accel Entertainment (ACEL) Outperforming Other Consumer Discretionary Stocks This Year?

Here is how Accel Entertainment (ACEL) and AMC Networks (AMCX) have performed compared to their sector so far this year.

Yahoo | December 28, 2023

AMC Networks Inc Director Matthew Blank Sells 50,000 Shares

On December 22, 2023, Matthew Blank, a director at AMC Networks Inc (NASDAQ:AMCX), sold 50,000 shares of the company's stock, according to a recent SEC Filing.

Yahoo | December 23, 2023

AMC Networks (AMCX) Is Attractively Priced Despite Fast-paced Momentum

AMC Networks (AMCX) made it through our 'Fast-Paced Momentum at a Bargain' screen and could be a great choice for investors looking for stocks that have gained strong momentum recently but are still trading at reasonable prices.

Yahoo | December 22, 2023

AMC Networks Inc EVP and General Counsel James Gallagher Sells 22,000 Shares

James Gallagher, EVP and General Counsel of AMC Networks Inc (NASDAQ:AMCX), has sold 22,000 shares of the company on December 19, 2023, according to a recent SEC Filing.

Yahoo | December 21, 2023

Small Stocks Are On A Tear — Investors Race To Buy These 10

Small stocks are blasting past the S&P 500 — and investors are loading up on a handful of them fast.

Yahoo | December 19, 2023

Read More 'AMCX' Stories Here

AMCX Price Returns

1-mo -4.79%
3-mo -35.50%
6-mo 2.89%
1-year -28.45%
3-year -76.91%
5-year -78.65%
YTD -35.50%
2023 19.91%
2022 -54.50%
2021 -3.72%
2020 -9.44%
2019 -28.02%

Get Free Updates

Join thousands of investors who get the latest news, insights and top rated picks from StockNews.com!