AMC Networks Inc. - (AMCX): Price and Financial Metrics
AMCX Price/Volume Stats
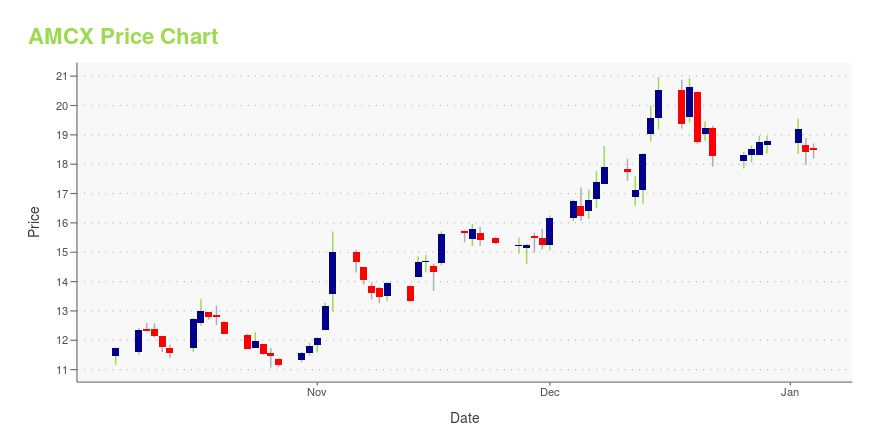
Current price | $16.77 | 52-week high | $27.46 |
Prev. close | $16.25 | 52-week low | $9.96 |
Day low | $16.14 | Volume | 355,300 |
Day high | $17.13 | Avg. volume | 418,624 |
50-day MA | $13.36 | Dividend yield | N/A |
200-day MA | $14.13 | Market Cap | 730.45M |
AMCX Stock Price Chart Interactive Chart >
AMCX POWR Grades
- Quality is the dimension where AMCX ranks best; there it ranks ahead of 92.8% of US stocks.
- The strongest trend for AMCX is in Quality, which has been heading up over the past 177 days.
- AMCX's current lowest rank is in the Momentum metric (where it is better than 11.79% of US stocks).
AMCX Stock Summary
- Price to trailing twelve month operating cash flow for AMCX is currently 2.55, higher than merely 8.48% of US stocks with positive operating cash flow.
- With a price/sales ratio of 0.23, AMC NETWORKS INC has a higher such ratio than merely 7.67% of stocks in our set.
- Over the past twelve months, AMCX has reported earnings growth of -88.24%, putting it ahead of just 15.56% of US stocks in our set.
- If you're looking for stocks that are quantitatively similar to AMC NETWORKS INC, a group of peers worth examining would be JBLU, PENN, KAR, ULH, and SBT.
- Visit AMCX's SEC page to see the company's official filings. To visit the company's web site, go to www.amcnetworks.com.
AMCX Valuation Summary
- AMCX's price/sales ratio is 0.2; this is 85.71% lower than that of the median Communication Services stock.
- Over the past 152 months, AMCX's EV/EBIT ratio has gone up 27.7.
Below are key valuation metrics over time for AMCX.
Stock | Date | P/S | P/B | P/E | EV/EBIT |
---|---|---|---|---|---|
AMCX | 2023-12-01 | 0.2 | 0.7 | -25.7 | 42.4 |
AMCX | 2023-11-30 | 0.2 | 0.6 | -24.2 | 41.7 |
AMCX | 2023-11-29 | 0.2 | 0.6 | -24.6 | 41.9 |
AMCX | 2023-11-28 | 0.2 | 0.6 | -24.2 | 41.8 |
AMCX | 2023-11-27 | 0.2 | 0.6 | -24.2 | 41.8 |
AMCX | 2023-11-24 | 0.2 | 0.6 | -24.3 | 41.8 |
AMCX Growth Metrics
- The year over year net income to common stockholders growth rate now stands at 3.65%.
- Its 3 year net cashflow from operations growth rate is now at -98.13%.
- Its 2 year cash and equivalents growth rate is now at 16.69%.

The table below shows AMCX's growth in key financial areas (numbers in millions of US dollars).
Date | Revenue | Operating Cash Flow | Net Income to Common Stock |
---|---|---|---|
2022-12-31 | 3,096.545 | 181.834 | 7.594 |
2022-09-30 | 2,935.734 | 136.081 | 289.322 |
2022-06-30 | 3,064.657 | 29.481 | 315.307 |
2022-03-31 | 3,098.024 | 12.356 | 267.763 |
2021-12-31 | 3,077.608 | 143.474 | 250.596 |
2021-09-30 | 3,054.174 | 148.633 | 328.268 |
AMCX's Quality Factors
The “Quality” component of the POWR Ratings focuses on 31 different factors of a companies fundamentals and operational strength. Here are some key insights as we drill into the specifics of these quality attributes.- AMCX has a Quality Grade of B, ranking ahead of 92.82% of graded US stocks.
- AMCX's asset turnover comes in at 0.543 -- ranking 15th of 64 Communication stocks.
- TMUS, ROKU, and CMCSA are the stocks whose asset turnover ratios are most correlated with AMCX.
The table below shows AMCX's key quality metrics over time.
Period | Asset Turnover | Gross Margin | ROIC |
---|---|---|---|
2021-06-30 | 0.543 | 0.519 | 0.136 |
2021-03-31 | 0.523 | 0.517 | 0.128 |
2020-12-31 | 0.530 | 0.502 | 0.124 |
2020-09-30 | 0.522 | 0.508 | 0.092 |
2020-06-30 | 0.528 | 0.512 | 0.094 |
2020-03-31 | 0.545 | 0.498 | 0.117 |
AMCX Price Target
For more insight on analysts targets of AMCX, see our AMCX price target page. And for a list of of all stocks sorted by upside potential based on analyst target price, see our Top Price Target page.
Average Price Target | $51.51 | Average Broker Recommendation | 2.12 (Hold) |
AMC Networks Inc. - (AMCX) Company Bio
AMC Networks owns and operates various cable televisions brands delivering content to audiences, and a platform to distributors and advertisers in the United States and internationally. The company was founded in 1980 and is based in New York, New York.
Latest AMCX News From Around the Web
Below are the latest news stories about AMC NETWORKS INC that investors may wish to consider to help them evaluate AMCX as an investment opportunity.
Fast-paced Momentum Stock AMC Networks (AMCX) Is Still Trading at a BargainIf you are looking for stocks that have gained strong momentum recently but are still trading at reasonable prices, AMC Networks (AMCX) could be a great choice. It is one of the several stocks that passed through our 'Fast-Paced Momentum at a Bargain' screen. |
Insider Sell: EVP and General Counsel James Gallagher Sells 13,874 Shares of AMC Networks Inc (AMCX)AMC Networks Inc (NASDAQ:AMCX) has recently witnessed an insider sell that has caught the attention of investors and market analysts. |
With 61% institutional ownership, AMC Networks Inc. (NASDAQ:AMCX) is a favorite amongst the big gunsKey Insights Institutions' substantial holdings in AMC Networks implies that they have significant influence over the... |
AMC Networks to Participate in the Bank of America Securities Leveraged Finance ConferenceNEW YORK, Nov. 15, 2023 (GLOBE NEWSWIRE) -- AMC Networks Inc. (NASDAQ: AMCX) today announced that Patrick O’Connell, Executive Vice President and Chief Financial Officer, will participate in the Bank of America Securities Leveraged Finance Conference on Tuesday, November 28, 2023, at 11:30 A.M. Eastern Time. A live webcast of the event will be available on the company’s website at www.amcnetworks.com under the heading “Investors.” A replay of the webcast will be available on the company’s websit |
12 Cheap NASDAQ Stocks To BuyIn this piece, we will take a look at the 12 cheap NASDAQ stocks to buy. To skip our overview of one of the world’s largest stock exchanges and some recent financial news, read 5 Cheap NASDAQ Stocks To Buy. Stocks markets have been taking a hammering over the past couple of years amid a […] |
AMCX Price Returns
1-mo | 19.19% |
3-mo | 59.41% |
6-mo | 40.10% |
1-year | -3.68% |
3-year | -47.77% |
5-year | -71.12% |
YTD | 7.02% |
2022 | -54.50% |
2021 | -3.72% |
2020 | -9.44% |
2019 | -28.02% |
2018 | 1.48% |
Continue Researching AMCX
Want to do more research on AMC Networks Inc's stock and its price? Try the links below:AMC Networks Inc (AMCX) Stock Price | Nasdaq
AMC Networks Inc (AMCX) Stock Quote, History and News - Yahoo Finance
AMC Networks Inc (AMCX) Stock Price and Basic Information | MarketWatch
Loading social stream, please wait...