
Anghami Inc. (ANGH): Price and Financial Metrics
ANGH Price/Volume Stats
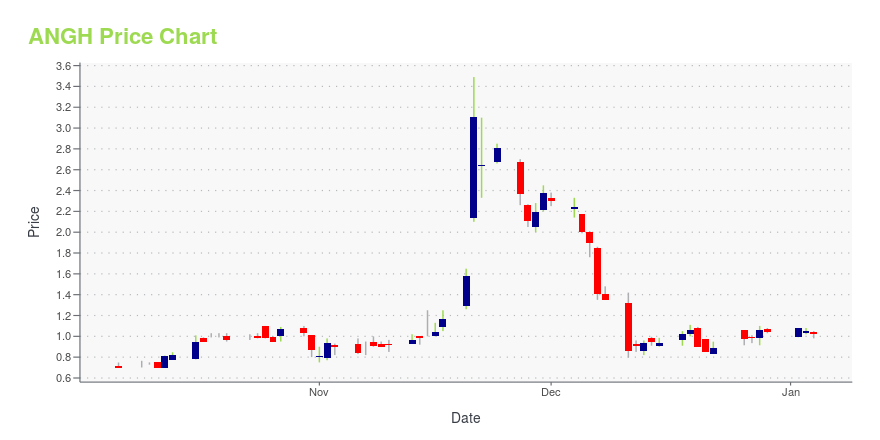
| Current price | $0.98 | 52-week high | $3.49 |
| Prev. close | $0.98 | 52-week low | $0.63 |
| Day low | $0.96 | Volume | 7,300 |
| Day high | $1.01 | Avg. volume | 225,178 |
| 50-day MA | $1.03 | Dividend yield | N/A |
| 200-day MA | $1.14 | Market Cap | 29.06M |
ANGH Stock Price Chart Interactive Chart >
Anghami Inc. (ANGH) Company Bio
Anghami Inc. operates a digital music entertainment technology platform in the Middle East and North Africa. It offers a music application and platform that provides Arabic and international music to stream and download. The company was founded in 2012 and is based in Abu Dhabi, the United Arab Emirates.
Latest ANGH News From Around the Web
Below are the latest news stories about ANGHAMI INC that investors may wish to consider to help them evaluate ANGH as an investment opportunity.
Today’s Biggest Pre-Market Stock Movers: 10 Top Gainers and Losers on WednesdayPre-market stock movers are a hot topic on Wednesday as we check out all of the biggest movements happening this morning! |
OSN+ and Anghami Sign Landmark Transaction Set to Transform MENA EntertainmentIn a milestone transaction set to reshape the MENA media and entertainment landscape, OSN+, the region's leading streaming platform for premium content and Anghami Inc. (NASDAQ: ANGH) ("Anghami"), the leading music and entertainment streaming platform in the Middle East and North Africa have announced a deal that will combine their businesses. A first of its kind in the region, the combination of the two local home-grown brands will offer consumers unprecedented digital aggregation of the best a |
3 Extra-Speculative Stocks That Could Make You Very, Very RichSpeculative stocks are a growth investor's dream—potential for untold riches, if you can find the stocks that will survive. |
3 Overlooked Media Stocks Ready for a BreakoutMedia stocks are more than movies and television, and these diverse companies stand ready to break free from broader industry trends. |
Investors Continue Waiting On Sidelines For Anghami Inc. (NASDAQ:ANGH)Anghami Inc.'s ( NASDAQ:ANGH ) price-to-sales (or "P/S") ratio of 0.6x may look like a pretty appealing investment... |
ANGH Price Returns
| 1-mo | -5.77% |
| 3-mo | -13.27% |
| 6-mo | -5.77% |
| 1-year | -9.26% |
| 3-year | N/A |
| 5-year | N/A |
| YTD | -5.77% |
| 2023 | -34.80% |
| 2022 | N/A |
| 2021 | N/A |
| 2020 | N/A |
| 2019 | N/A |
Loading social stream, please wait...