Aptiv PLC (APTV): Price and Financial Metrics
APTV Price/Volume Stats
Current price | $88.08 | 52-week high | $124.88 |
Prev. close | $91.23 | 52-week low | $77.96 |
Day low | $86.67 | Volume | 4,347,900 |
Day high | $90.13 | Avg. volume | 1,906,522 |
50-day MA | $100.92 | Dividend yield | N/A |
200-day MA | $100.49 | Market Cap | 23.83B |
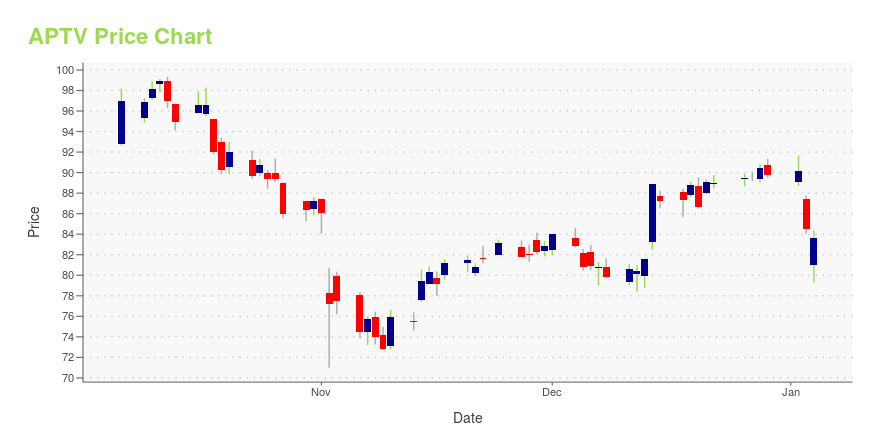
APTV Stock Price Chart Interactive Chart >
APTV POWR Grades
- APTV scores best on the Growth dimension, with a Growth rank ahead of 90.71% of US stocks.
- The strongest trend for APTV is in Momentum, which has been heading up over the past 179 days.
- APTV's current lowest rank is in the Value metric (where it is better than 22.53% of US stocks).
APTV Stock Summary
- APTV has a market capitalization of $24,480,829,019 -- more than approximately 91.4% of US stocks.
- With a price/earnings ratio of 40.53, APTIV PLC P/E ratio is greater than that of about 84.26% of stocks in our set with positive earnings.
- In terms of twelve month growth in earnings before interest and taxes, APTIV PLC is reporting a growth rate of 70.87%; that's higher than 83.77% of US stocks.
- Stocks that are quantitatively similar to APTV, based on their financial statements, market capitalization, and price volatility, are URI, PWR, LH, IR, and LHX.
- Visit APTV's SEC page to see the company's official filings. To visit the company's web site, go to www.aptiv.com.
APTV Valuation Summary
- APTV's price/earnings ratio is 42.3; this is 215.67% higher than that of the median Consumer Cyclical stock.
- Over the past 140 months, APTV's price/earnings ratio has gone up 34.8.
Below are key valuation metrics over time for APTV.
Stock | Date | P/S | P/B | P/E | EV/EBIT |
---|---|---|---|---|---|
APTV | 2023-05-19 | 1.4 | 2.8 | 42.3 | 30.0 |
APTV | 2023-05-18 | 1.4 | 2.9 | 42.5 | 30.1 |
APTV | 2023-05-17 | 1.4 | 2.8 | 42.0 | 29.8 |
APTV | 2023-05-16 | 1.4 | 2.7 | 40.7 | 29.1 |
APTV | 2023-05-15 | 1.4 | 2.8 | 41.6 | 29.6 |
APTV | 2023-05-12 | 1.4 | 2.8 | 41.5 | 29.5 |
APTV Growth Metrics
- Its year over year revenue growth rate is now at 13.78%.
- The 4 year revenue growth rate now stands at -17.12%.
- Its year over year price growth rate is now at -26.04%.

The table below shows APTV's growth in key financial areas (numbers in millions of US dollars).
Date | Revenue | Operating Cash Flow | Net Income to Common Stock |
---|---|---|---|
2022-12-31 | 17,489 | 1,263 | 531 |
2022-09-30 | 16,983 | 999 | 313 |
2022-06-30 | 16,023 | 566 | 113 |
2022-03-31 | 15,773 | 768 | 321 |
2021-12-31 | 15,618 | 1,222 | 527 |
2021-09-30 | 15,696 | 1,352 | 795 |
APTV's Quality Factors
The “Quality” component of the POWR Ratings focuses on 31 different factors of a companies fundamentals and operational strength. Here are some key insights as we drill into the specifics of these quality attributes.- APTV has a Quality Grade of C, ranking ahead of 72.75% of graded US stocks.
- APTV's asset turnover comes in at 0.908 -- ranking 37th of 68 Automobiles and Trucks stocks.
- THRM, ADNT, and WNC are the stocks whose asset turnover ratios are most correlated with APTV.
The table below shows APTV's key quality metrics over time.
Period | Asset Turnover | Gross Margin | ROIC |
---|---|---|---|
2021-06-30 | 0.908 | 0.175 | 0.117 |
2021-03-31 | 0.831 | 0.156 | 0.068 |
2020-12-31 | 0.799 | 0.148 | 0.169 |
2020-09-30 | 0.812 | 0.148 | 0.166 |
2020-06-30 | 0.853 | 0.152 | 0.170 |
2020-03-31 | 1.006 | 0.181 | 0.239 |
Latest APTV News From Around the Web
Below are the latest news stories about APTIV PLC that investors may wish to consider to help them evaluate APTV as an investment opportunity.
The EV Boom Is Here: Buy These 2 StocksGood news for investors who have been waiting for a surge in electric vehicle (EV) sales: The EV boom is here. Rivian Automotive (NASDAQ: RIVN), a relative newcomer to the EV manufacturing race, has a number of things going for it as it tries to convince investors it could be the next great EV stock. The EV manufacturer's production was slow to start 2023 due to retooling its electric delivery van (EDV) assembly line, but management confirmed it still expects to reach 50,000 in production units for the full year, which will be a 100% increase compared to 2022. |
Top Growth Stocks for May 2023Zimmer Biomet Holdings Inc and Nordic American Tankers are top stocks for EPS and revenue growth, respectively. |
Calculating The Intrinsic Value Of Aptiv PLC (NYSE:APTV)Key Insights Using the 2 Stage Free Cash Flow to Equity, Aptiv fair value estimate is US$113 With US$93.42 share price... |
Aptiv (APTV) Q1 Earnings Beat Estimates, Increase Y/YAptiv's (APTV) first-quarter 2023 revenues improve year over year. |
Top Robotics Stocks for Q2 2023While robots in the past were used mostly in industrial applications, robotics are now being employed for security, health care, aerospace, food and beverage uses, and education. Amid these advances, market research analysts have forecast the robotics market will expand to $214.7 billion by 2030, growing at a compound annual growth rate (CAGR) of almost 23%. With such an increasing investment opportunity, robot and automation stocks, as represented by the ROBO Global Robotics and Automation Index ETF (ROBO), an exchange-traded fund (ETF), have outperformed the broader market. |
APTV Price Returns
1-mo | -12.99% |
3-mo | -26.17% |
6-mo | -15.09% |
1-year | -18.08% |
3-year | 14.93% |
5-year | -9.46% |
YTD | -5.42% |
2022 | -43.54% |
2021 | 26.60% |
2020 | 37.54% |
2019 | 55.89% |
2018 | -26.70% |
Continue Researching APTV
Want to see what other sources are saying about Aptiv PLC's financials and stock price? Try the links below:Aptiv PLC (APTV) Stock Price | Nasdaq
Aptiv PLC (APTV) Stock Quote, History and News - Yahoo Finance
Aptiv PLC (APTV) Stock Price and Basic Information | MarketWatch
Loading social stream, please wait...