Array Technologies Inc. (ARRY): Price and Financial Metrics
ARRY Price/Volume Stats
Current price | $22.74 | 52-week high | $24.99 |
Prev. close | $23.03 | 52-week low | $9.24 |
Day low | $22.01 | Volume | 4,067,800 |
Day high | $23.86 | Avg. volume | 4,704,940 |
50-day MA | $20.76 | Dividend yield | N/A |
200-day MA | $20.03 | Market Cap | 3.43B |
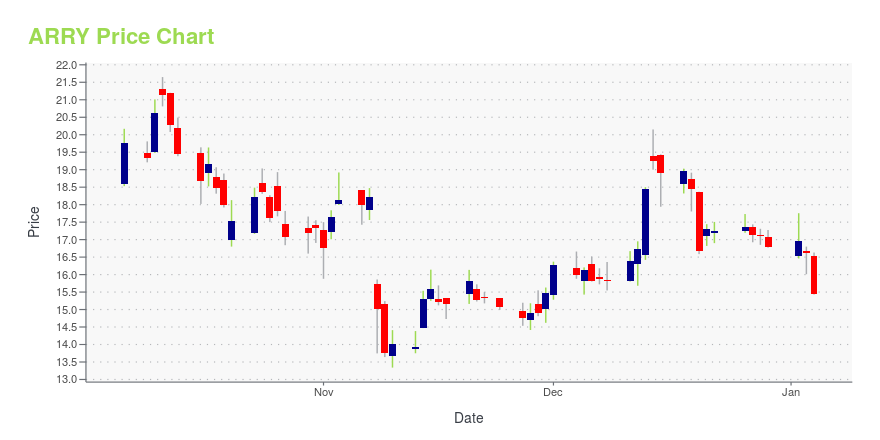
ARRY Stock Price Chart Interactive Chart >
ARRY POWR Grades
- ARRY scores best on the Growth dimension, with a Growth rank ahead of 91.38% of US stocks.
- The strongest trend for ARRY is in Stability, which has been heading down over the past 179 days.
- ARRY ranks lowest in Stability; there it ranks in the 1st percentile.
ARRY Stock Summary
- ARRAY TECHNOLOGIES INC's capital turnover -- a measure of revenue relative to shareholder's equity -- is better than 95.1% of US listed stocks.
- ARRY's current price/earnings ratio is 968.72, which is higher than 99.27% of US stocks with positive earnings.
- ARRY's equity multiplier -- a measure of assets relative to shareholders'equity -- is greater than that of 96.06% of US stocks.
- Stocks with similar financial metrics, market capitalization, and price volatility to ARRAY TECHNOLOGIES INC are HGTY, AMPS, PETS, CINF, and MORN.
- ARRY's SEC filings can be seen here. And to visit ARRAY TECHNOLOGIES INC's official web site, go to arraytechinc.com.
ARRY Valuation Summary
- ARRY's price/earnings ratio is 997.4; this is 3642.59% higher than that of the median Technology stock.
- ARRY's price/sales ratio has moved down 5 over the prior 32 months.
Below are key valuation metrics over time for ARRY.
Stock | Date | P/S | P/B | P/E | EV/EBIT |
---|---|---|---|---|---|
ARRY | 2023-05-22 | 2.1 | 17.7 | 997.4 | 42.0 |
ARRY | 2023-05-19 | 2.0 | 16.8 | 946.6 | 40.2 |
ARRY | 2023-05-18 | 2.0 | 16.7 | 939.7 | 39.9 |
ARRY | 2023-05-17 | 2.0 | 16.5 | 928.2 | 39.5 |
ARRY | 2023-05-16 | 2.0 | 16.3 | 917.6 | 39.1 |
ARRY | 2023-05-15 | 2.1 | 17.1 | 959.7 | 40.6 |
ARRY Price Target
For more insight on analysts targets of ARRY, see our ARRY price target page. And for a list of of all stocks sorted by upside potential based on analyst target price, see our Top Price Target page.
Average Price Target | $24.55 | Average Broker Recommendation | 1.81 (Hold) |
Array Technologies Inc. (ARRY) Company Bio
Array Technologies, Inc. provides solar tracking solutions and services for utility-scale projects. Its products include DuraTrack HZ v3, a single-axis solar tracking system; and SmarTrack, a machine learning software that automatically adjusts module angles in response to weather and site conditions. The company was founded in 1989 and is based in Albuquerque, New Mexico with additional offices in Europe, Central America, and Australia.
Latest ARRY News From Around the Web
Below are the latest news stories about ARRAY TECHNOLOGIES INC that investors may wish to consider to help them evaluate ARRY as an investment opportunity.
3 Energy Stocks That Have Game-Changing TechnologiesNew, game-changing energy technologies are emerging and proliferating, making many energy stocks very attractive. |
IPO Stock Of The Week: Hot Solar Stock Array Hits Buy Point With 213% Earnings GrowthIPO stock of the week and hot solar stock Array Technologies topped a buy point in recent sessions. Array boasts huge earnings growth. |
7 High-Reward Stocks Riding the Green Energy BoomWith the world's largest governments backing renewable energy, the best renewable names are poised to be very high-reward stocks. |
7 Top-Rated Tech Stocks Worth Taking a Risk OnBy their very nature, tech stocks have the potential to thrill investors and provide outsized returns. |
Is Array Technologies, Inc.'s (NASDAQ:ARRY) ROE Of 11% Concerning?Many investors are still learning about the various metrics that can be useful when analysing a stock. This article is... |
ARRY Price Returns
1-mo | 15.02% |
3-mo | 20.57% |
6-mo | 2.34% |
1-year | 105.23% |
3-year | N/A |
5-year | N/A |
YTD | 17.64% |
2022 | 23.20% |
2021 | -63.63% |
2020 | N/A |
2019 | N/A |
2018 | N/A |
Loading social stream, please wait...