
Anterix Inc. (ATEX): Price and Financial Metrics
ATEX Price/Volume Stats
| Current price | $40.27 | 52-week high | $42.41 |
| Prev. close | $39.88 | 52-week low | $27.20 |
| Day low | $39.88 | Volume | 56,500 |
| Day high | $41.12 | Avg. volume | 125,760 |
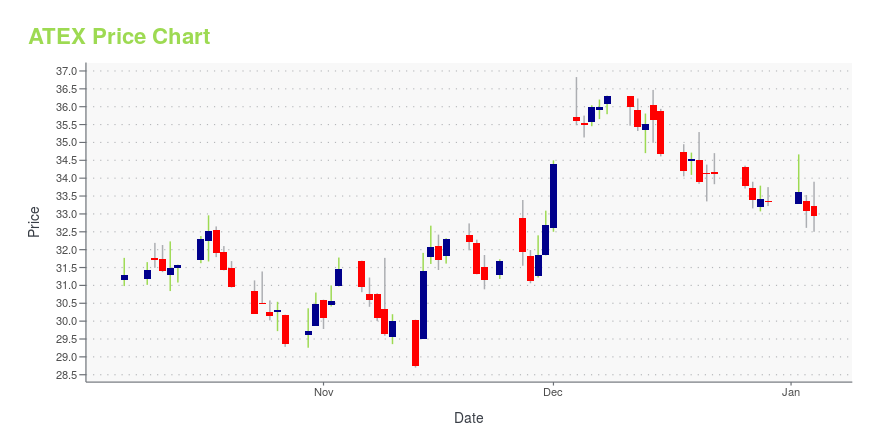
| 50-day MA | $35.48 | Dividend yield | N/A |
| 200-day MA | $33.50 | Market Cap | 747.77M |
ATEX Stock Price Chart Interactive Chart >
Anterix Inc. (ATEX) Company Bio
Anterix Inc. operates as a wireless communications company. The company focuses on commercializing its spectrum assets to enable the targeted utility and critical infrastructure customers to deploy private broadband networks, technologies, and solutions. It holds licensed spectrum in the 900 MHz band with nationwide coverage throughout the United States, Hawaii, Alaska, and Puerto Rico. The company was formerly known as pdvWireless, Inc. and changed its name to Anterix Inc. in August 2019. Anterix Inc. was incorporated in 1997 and is headquartered in Woodland Park, New Jersey.
Latest ATEX News From Around the Web
Below are the latest news stories about ANTERIX INC that investors may wish to consider to help them evaluate ATEX as an investment opportunity.
Anterix (ATEX) Upgraded to Buy: What Does It Mean for the Stock?Anterix (ATEX) has been upgraded to a Zacks Rank #2 (Buy), reflecting growing optimism about the company's earnings prospects. This might drive the stock higher in the near term. |
Does Anterix (ATEX) Have the Potential to Rally 62.97% as Wall Street Analysts Expect?The mean of analysts' price targets for Anterix (ATEX) points to a 63% upside in the stock. While this highly sought-after metric has not proven reasonably effective, strong agreement among analysts in raising earnings estimates does indicate an upside in the stock. |
ANTERIX TO PRESENT AT OPPENHEIMER AND NEW STREET INVESTOR CONFERENCESAnterix (NASDAQ: ATEX) announced today that it will present at the following investor conferences in December 2023. |
INDUSTRY TECHNOLOGY LEADER TAMPA ELECTRIC JOINS THE PRIVATE LTE MOVEMENT WITH 900 MHz SPECTRUM AGREEMENTAnterix (NASDAQ: ATEX) announced today that Tampa Electric ("TECO"), a subsidiary of Emera Inc., has signed an agreement providing TECO the use of Anterix's 900 MHz spectrum throughout the company's service territory in West Central Florida. The agreement provides TECO dedicated use of the 900 MHz spectrum for 20 years, with two optional ten-year extensions. |
Wall Street Analysts Predict an 87.26% Upside in Anterix (ATEX): Here's What You Should KnowThe average of price targets set by Wall Street analysts indicates a potential upside of 87.3% in Anterix (ATEX). While the effectiveness of this highly sought-after metric is questionable, the positive trend in earnings estimate revisions might translate into an upside in the stock. |
ATEX Price Returns
| 1-mo | 29.82% |
| 3-mo | 25.02% |
| 6-mo | 34.46% |
| 1-year | 43.36% |
| 3-year | -31.10% |
| 5-year | -10.85% |
| YTD | 20.86% |
| 2023 | 3.57% |
| 2022 | -45.25% |
| 2021 | 56.28% |
| 2020 | -12.98% |
| 2019 | 15.57% |
Loading social stream, please wait...