
Allegheny Technologies Incorporated (ATI): Price and Financial Metrics
ATI Price/Volume Stats
| Current price | $65.54 | 52-week high | $66.43 |
| Prev. close | $64.28 | 52-week low | $35.03 |
| Day low | $64.18 | Volume | 1,257,100 |
| Day high | $66.43 | Avg. volume | 1,478,856 |
| 50-day MA | $58.61 | Dividend yield | N/A |
| 200-day MA | $48.94 | Market Cap | 8.16B |
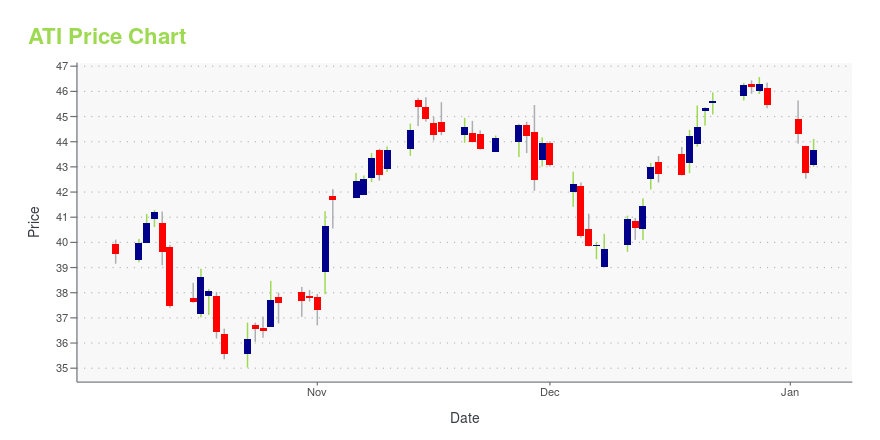
ATI Stock Price Chart Interactive Chart >
Allegheny Technologies Incorporated (ATI) Company Bio
Allegheny Technologies offers a wide range of specialty materials solutions. Our major markets are aerospace and defense, oil and gas/chemical process industry, electrical energy, medical, automotive, food equipment and appliance, and construction and mining. The company was founded in 1960 and is based in Pittsburgh, Pennsylvania.
Latest ATI News From Around the Web
Below are the latest news stories about ATI INC that investors may wish to consider to help them evaluate ATI as an investment opportunity.
7 Under-the-Radar Stocks Gearing Up for a 2025 BreakthroughIn a market where giants often grab the spotlight, a cadre of quietly thriving companies has been making significant strategic strides. |
ATI targets 2027 revenue exceeding $5 billion on platform of organic growthAt its 2023 Investor Update, ATI Inc. (NYSE: ATI) forecast revenues exceeding $5 billion with adjusted EBITDA of $1 billion by 2027. "As we close out a successful 2023, ATI is well-positioned to significantly increase cash generation and deployment to shareholders over the next four years," said Robert S. Wetherbee, Board Chair and CEO. The company projects more than $1 billion in top-line organic growth and a 60% increase in adjusted earnings from 2023 to 2027. "ATI's aerospace and defense foun |
ATI (NYSE:ATI) Might Have The Makings Of A Multi-BaggerFinding a business that has the potential to grow substantially is not easy, but it is possible if we look at a few key... |
Allegheny Technologies (ATI) Reports Q3 Earnings: What Key Metrics Have to SayAlthough the revenue and EPS for Allegheny Technologies (ATI) give a sense of how its business performed in the quarter ended September 2023, it might be worth considering how some key metrics compare with Wall Street estimates and the year-ago numbers. |
ATI Announces Third Quarter 2023 ResultsATI Inc. (NYSE: ATI) reported third quarter 2023 results, with sales of $1.03 billion and net income attributable to ATI of $75.7 million, or $0.52 per share. |
ATI Price Returns
| 1-mo | 16.47% |
| 3-mo | 26.65% |
| 6-mo | 59.35% |
| 1-year | 41.10% |
| 3-year | 219.86% |
| 5-year | 186.58% |
| YTD | 44.14% |
| 2023 | 52.28% |
| 2022 | 87.45% |
| 2021 | -5.01% |
| 2020 | -18.83% |
| 2019 | -5.10% |
Continue Researching ATI
Want to do more research on Allegheny Technologies Inc's stock and its price? Try the links below:Allegheny Technologies Inc (ATI) Stock Price | Nasdaq
Allegheny Technologies Inc (ATI) Stock Quote, History and News - Yahoo Finance
Allegheny Technologies Inc (ATI) Stock Price and Basic Information | MarketWatch
Loading social stream, please wait...