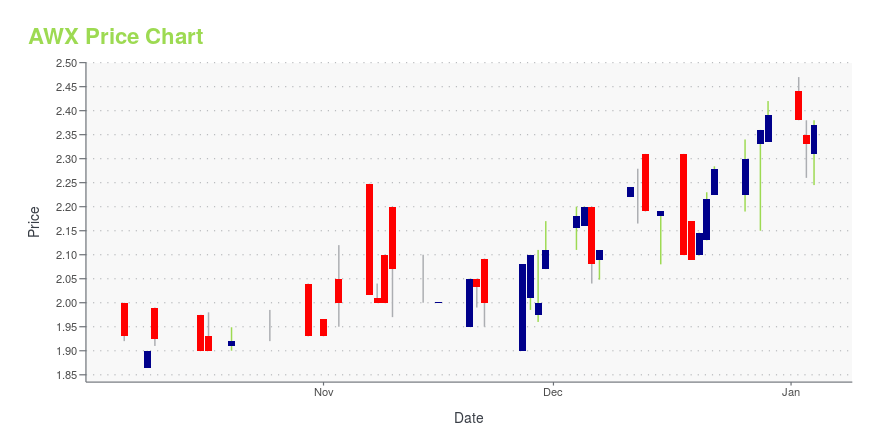
Avalon Holdings Corporation (AWX): Price and Financial Metrics
GET POWR RATINGS... FREE!
AWX Stock Summary
- AWX has a market capitalization of $12,868,122 -- more than approximately only 1.25% of US stocks.
- AWX's current price/earnings ratio is 6.53, which is higher than only 11.92% of US stocks with positive earnings.
- With a price/sales ratio of 0.18, Avalon Holdings Corp has a higher such ratio than merely 2.56% of stocks in our set.
- If you're looking for stocks that are quantitatively similar to Avalon Holdings Corp, a group of peers worth examining would be CODI, SKYW, BH, PTSI, and RICK.
- AWX's SEC filings can be seen here. And to visit Avalon Holdings Corp's official web site, go to www.avalonholdings.com.
AWX Valuation Summary
- In comparison to the median Industrials stock, AWX's EV/EBIT ratio is 63.39% lower, now standing at 8.
- AWX's price/sales ratio has moved up 0.2 over the prior 243 months.
- AWX's price/earnings ratio has moved up 8.6 over the prior 243 months.
Below are key valuation metrics over time for AWX.
Stock | Date | P/S | P/B | P/E | EV/EBIT |
---|---|---|---|---|---|
AWX | 2021-09-03 | 0.3 | 0.4 | 5.8 | 8.0 |
AWX | 2021-09-02 | 0.3 | 0.4 | 5.8 | 8.0 |
AWX | 2021-09-01 | 0.3 | 0.4 | 6.2 | 8.3 |
AWX | 2021-08-31 | 0.3 | 0.4 | 6.3 | 8.3 |
AWX | 2021-08-30 | 0.3 | 0.4 | 6.2 | 8.3 |
AWX | 2021-08-27 | 0.3 | 0.4 | 6.2 | 8.2 |
AWX Growth Metrics
- Its year over year net income to common stockholders growth rate is now at 344.92%.
- Its 3 year price growth rate is now at 32.82%.
- Its 3 year net income to common stockholders growth rate is now at -69.48%.

The table below shows AWX's growth in key financial areas (numbers in millions of US dollars).
Date | Revenue | Operating Cash Flow | Net Income to Common Stock |
---|---|---|---|
2021-12-31 | 70.383 | 2.363 | 1.971 |
2021-09-30 | 67.429 | 2.874 | 2.922 |
2021-06-30 | 62.753 | 2.249 | 2.72 |
2021-03-31 | 59.43 | 3.234 | 1.543 |
2020-12-31 | 58.72 | 2.571 | 0.014 |
2020-09-30 | 61.401 | 1.837 | -0.907 |
AWX Stock Price Chart Interactive Chart >
AWX Price/Volume Stats
Current price | $2.79 | 52-week high | $5.66 |
Prev. close | $2.60 | 52-week low | $2.58 |
Day low | $2.70 | Volume | 600 |
Day high | $2.79 | Avg. volume | 7,774 |
50-day MA | $3.05 | Dividend yield | N/A |
200-day MA | $3.52 | Market Cap | 10.88M |
Avalon Holdings Corporation (AWX) Company Bio
Avalon Holdings Corporation provides waste management services to industrial, commercial, municipal, and governmental customers in the United States. It operates through Waste Management Services, and Golf and Related Operations segments. The Waste Management Services segment offers hazardous and nonhazardous waste disposal brokerage and management services; and captive landfill management services, as well as engages in salt water injection well operations. This segment also provides turnkey services, including daily operations, facilities management, and management reporting; and sells construction mats. The Golf and Related Operations segment operates and manages three golf courses and related clubhouses, a hotel, and a travel agency. Its golf and country club facilities provide swimming pools, fitness centers, tennis courts, dining, and banquet and conference facilities, as well as spa services. The company also owns and operates hotel under the brand of The Grand Resort, which provides various facilities, such as swimming pool, fitness center, rooms, restaurants, bars, banquet, and conference facilities, as well as adjoining tennis center. The company was founded in 1998 and is headquartered in Warren, Ohio. Avalon Holdings Corporation operates as a subsidiary of The Hain Celestial Group, Inc.
Latest AWX News From Around the Web
Below are the latest news stories about Avalon Holdings Corp that investors may wish to consider to help them evaluate AWX as an investment opportunity.
Avalon Holdings Corporation Announces Third Quarter ResultsAvalon Holdings Corporation (NYSE Amex: AWX) today announced financial results for the third quarter of 2021. |
Avalon Holdings Corporation Announces Second Quarter ResultsAvalon Holdings Corporation (NYSE Amex: AWX) today announced financial results for the second quarter of 2021. |
Avalon Holdings Corporation Announces First Quarter ResultsAvalon Holdings Corporation (NYSE Amex: AWX) today announced financial results for the first quarter of 2021. |
Avalon Holdings (NYSEMKT:AWX) Might Have The Makings Of A Multi-BaggerDid you know there are some financial metrics that can provide clues of a potential multi-bagger? Typically, we'll want... |
Avalon Holdings Corporation Announces 2020 Full Year And Fourth Quarter ResultsAvalon Holdings Corporation (NYSE Amex: AWX) today announced financial results for the fourth quarter and fiscal year ended December 31, 2020. |
AWX Price Returns
1-mo | -6.06% |
3-mo | -14.15% |
6-mo | -26.19% |
1-year | N/A |
3-year | 9.41% |
5-year | 18.72% |
YTD | -22.71% |
2021 | 38.85% |
2020 | 35.42% |
2019 | -27.55% |
2018 | 32.50% |
2017 | -32.20% |
Continue Researching AWX
Want to do more research on Avalon Holdings Corp's stock and its price? Try the links below:Avalon Holdings Corp (AWX) Stock Price | Nasdaq
Avalon Holdings Corp (AWX) Stock Quote, History and News - Yahoo Finance
Avalon Holdings Corp (AWX) Stock Price and Basic Information | MarketWatch
Loading social stream, please wait...