AMREP Corporation (AXR): Price and Financial Metrics
GET POWR RATINGS... FREE!
AXR Stock Summary
- Amrep Corp's stock had its IPO on January 1, 1986, making it an older stock than 92.84% of US equities in our set.
- In terms of twelve month growth in earnings before interest and taxes, Amrep Corp is reporting a growth rate of -2,472.89%; that's higher than merely 0.78% of US stocks.
- As for revenue growth, note that AXR's revenue has grown 111.93% over the past 12 months; that beats the revenue growth of 92.72% of US companies in our set.
- If you're looking for stocks that are quantitatively similar to Amrep Corp, a group of peers worth examining would be FRD, FSTR, CCRN, RAVE, and JW.A.
- Visit AXR's SEC page to see the company's official filings. To visit the company's web site, go to www.amrepcorp.com.
AXR Valuation Summary
- In comparison to the median Real Estate stock, AXR's EV/EBIT ratio is 73.73% lower, now standing at 10.1.
- AXR's EV/EBIT ratio has moved down 34.6 over the prior 243 months.
- AXR's price/earnings ratio has moved up 5.6 over the prior 243 months.
Below are key valuation metrics over time for AXR.
Stock | Date | P/S | P/B | P/E | EV/EBIT |
---|---|---|---|---|---|
AXR | 2021-09-02 | 3.1 | 1.4 | 16.7 | 10.1 |
AXR | 2021-09-01 | 2.9 | 1.3 | 15.9 | 9.5 |
AXR | 2021-08-31 | 2.8 | 1.2 | 14.9 | 8.8 |
AXR | 2021-08-30 | 2.6 | 1.2 | 14.2 | 8.3 |
AXR | 2021-08-27 | 2.5 | 1.1 | 13.8 | 8.0 |
AXR | 2021-08-26 | 2.5 | 1.1 | 13.6 | 7.9 |
AXR Growth Metrics
- Its 4 year cash and equivalents growth rate is now at 20.19%.
- Its year over year net income to common stockholders growth rate is now at 225.22%.
- Its 2 year price growth rate is now at -37.03%.

The table below shows AXR's growth in key financial areas (numbers in millions of US dollars).
Date | Revenue | Operating Cash Flow | Net Income to Common Stock |
---|---|---|---|
2021-12-31 | 55.302 | 12.596 | 9.781 |
2021-09-30 | 53.35 | 15.001 | 10.964 |
2021-06-30 | 46.37 | 10.203 | 8.436 |
2021-03-31 | 40.069 | 12.609 | 7.392 |
2020-12-31 | 26.095 | 1.539 | -0.392 |
2020-09-30 | 23.518 | 1.823 | -2.147 |
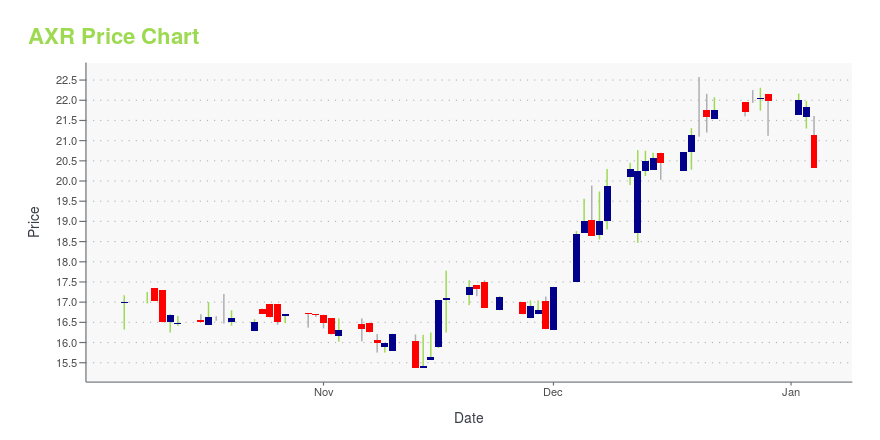
AXR Stock Price Chart Interactive Chart >
AXR Price/Volume Stats
Current price | $10.84 | 52-week high | $18.80 |
Prev. close | $11.07 | 52-week low | $9.88 |
Day low | $10.84 | Volume | 4,300 |
Day high | $11.25 | Avg. volume | 13,665 |
50-day MA | $12.30 | Dividend yield | N/A |
200-day MA | $13.56 | Market Cap | 79.52M |
Latest AXR News From Around the Web
Below are the latest news stories about Amrep Corp that investors may wish to consider to help them evaluate AXR as an investment opportunity.
AMREP (NYSE:AXR) Could Easily Take On More DebtWarren Buffett famously said, 'Volatility is far from synonymous with risk.' It's only natural to consider a company's... |
Head to Head Comparison: AMREP (NYSE:AXR) & IRSA Inversiones y Representaciones Sociedad Anónima (NYSE:IRS)AMREP (NYSE:AXR) and IRSA Inversiones y Representaciones Sociedad Anónima (NYSE:IRS) are both small-cap finance companies, but which is the better stock? We will contrast the two companies based on the strength of their institutional ownership, dividends, analyst recommendations, profitability, valuation, risk and earnings. Insider & Institutional Ownership 36.9% of AMREP shares are held by institutional [] |
AMREP reports FQ2 resultsNo summary available. |
AMREP Reports Second Quarter Fiscal 2022 ResultsHAVERTOWN, Pa., Dec. 08, 2021 (GLOBE NEWSWIRE) -- AMREP Corporation (NYSE:AXR) today reported net income of $3,326,000, or $0.45 per diluted share, for its 2022 fiscal second quarter ended October 31, 2021 compared to net income of $798,000, or $0.10 per diluted share, for the same period of the prior year. For the first six months of 2022, AMREP had net income of $4,963,000, or $0.67 per diluted share, compared to net income of $1,391,000, or $0.17 per diluted share, for the same period of 2021. Revenues were $16,236,000 and $26,743,000 for the second quarter and first six months of 2022 and $9,256,000 and $13,462,000 for the second quarter and first six months of 2021. |
Financial Survey: AMREP (NYSE:AXR) vs. Country Garden (OTCMKTS:CTRYY)Country Garden (OTCMKTS:CTRYY) and AMREP (NYSE:AXR) are both finance companies, but which is the better stock? We will contrast the two businesses based on the strength of their valuation, risk, earnings, institutional ownership, analyst recommendations, profitability and dividends. Analyst Ratings This is a summary of current recommendations and price targets for Country Garden and AMREP, [] |
AXR Price Returns
1-mo | -13.49% |
3-mo | -19.10% |
6-mo | -28.38% |
1-year | -12.23% |
3-year | 58.02% |
5-year | 59.88% |
YTD | -28.68% |
2021 | 77.99% |
2020 | 42.81% |
2019 | 0.50% |
2018 | -15.24% |
2017 | -5.39% |
Continue Researching AXR
Here are a few links from around the web to help you further your research on Amrep Corp's stock as an investment opportunity:Amrep Corp (AXR) Stock Price | Nasdaq
Amrep Corp (AXR) Stock Quote, History and News - Yahoo Finance
Amrep Corp (AXR) Stock Price and Basic Information | MarketWatch
Loading social stream, please wait...