Brandywine Realty Trust (BDN): Price and Financial Metrics
GET POWR RATINGS... FREE!
BDN POWR Grades
- Value is the dimension where BDN ranks best; there it ranks ahead of 68% of US stocks.
- The strongest trend for BDN is in Growth, which has been heading down over the past 177 days.
- BDN ranks lowest in Sentiment; there it ranks in the 18th percentile.
BDN Stock Summary
- With a one year PEG ratio of 1,586.93, BRANDYWINE REALTY TRUST is expected to have a higher PEG ratio (a measure of how expensive a stock is relative to its expected earnings growth) than 98.2% of US stocks.
- BDN's went public 36.56 years ago, making it older than 92.98% of listed US stocks we're tracking.
- Of note is the ratio of BRANDYWINE REALTY TRUST's sales and general administrative expense to its total operating expenses; just 6.64% of US stocks have a lower such ratio.
- Stocks with similar financial metrics, market capitalization, and price volatility to BRANDYWINE REALTY TRUST are DEA, WPC, DEI, ADC, and HIW.
- BDN's SEC filings can be seen here. And to visit BRANDYWINE REALTY TRUST's official web site, go to www.brandywinerealty.com.
BDN Valuation Summary
- BDN's price/sales ratio is 2.2; this is 69.23% higher than that of the median Real Estate stock.
- BDN's price/sales ratio has moved down 0.1 over the prior 243 months.
Below are key valuation metrics over time for BDN.
Stock | Date | P/S | P/B | P/E | EV/EBIT |
---|---|---|---|---|---|
BDN | 2023-02-01 | 2.2 | 0.7 | 39.2 | 33.9 |
BDN | 2023-01-31 | 2.2 | 0.7 | 39.8 | 34.1 |
BDN | 2023-01-30 | 2.2 | 0.7 | 38.4 | 33.7 |
BDN | 2023-01-27 | 2.2 | 0.7 | 39.1 | 33.9 |
BDN | 2023-01-26 | 2.1 | 0.7 | 37.4 | 33.4 |
BDN | 2023-01-25 | 2.1 | 0.7 | 37.4 | 33.4 |
BDN Growth Metrics
- The 2 year price growth rate now stands at 13.33%.
- The 5 year net cashflow from operations growth rate now stands at 15.2%.
- The 5 year net income to common stockholders growth rate now stands at 359.11%.

The table below shows BDN's growth in key financial areas (numbers in millions of US dollars).
Date | Revenue | Operating Cash Flow | Net Income to Common Stock |
---|---|---|---|
2022-09-30 | 502.646 | 198.317 | 28.298 |
2022-06-30 | 497.495 | 190.242 | 15.838 |
2022-03-31 | 493.555 | 178.213 | 11.038 |
2021-12-31 | 486.819 | 190.874 | 11.868 |
2021-09-30 | 488.11 | 204.061 | 26.285 |
2021-06-30 | 493.798 | 204.612 | 299.837 |
BDN's Quality Factors
The “Quality” component of the POWR Ratings focuses on 31 different factors of a companies fundamentals and operational strength. Here are some key insights as we drill into the specifics of these quality attributes.- BDN has a Quality Grade of C, ranking ahead of 33.88% of graded US stocks.
- BDN's asset turnover comes in at 0.126 -- ranking 150th of 444 Trading stocks.
- AAIC, EQR, and DEI are the stocks whose asset turnover ratios are most correlated with BDN.
The table below shows BDN's key quality metrics over time.
Period | Asset Turnover | Gross Margin | ROIC |
---|---|---|---|
2021-09-30 | 0.126 | 0.614 | 0.016 |
2021-06-30 | 0.126 | 0.615 | 0.064 |
2021-03-31 | 0.129 | 0.618 | 0.065 |
2020-12-31 | 0.134 | 0.616 | 0.064 |
2020-09-30 | 0.138 | 0.615 | 0.063 |
2020-06-30 | 0.142 | 0.616 | 0.019 |
BDN Price Target
For more insight on analysts targets of BDN, see our BDN price target page. And for a list of of all stocks sorted by upside potential based on analyst target price, see our Top Price Target page.
Average Price Target | $14.42 | Average Broker Recommendation | 1.93 (Hold) |
BDN Stock Price Chart Interactive Chart >
BDN Price/Volume Stats
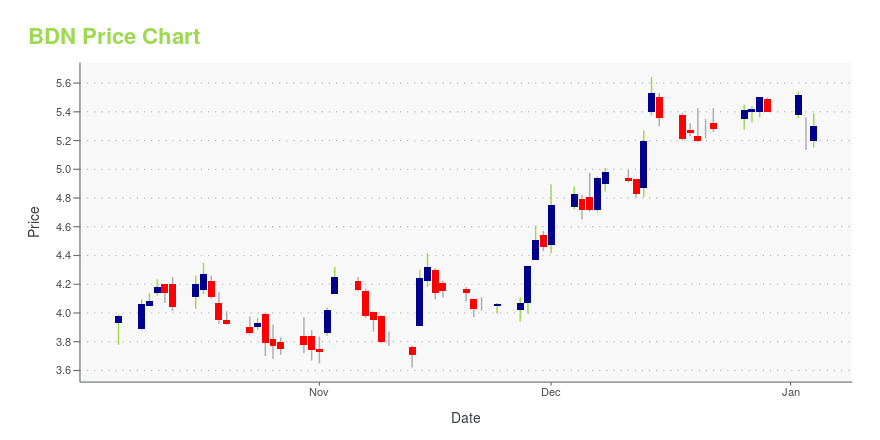
Current price | $6.72 | 52-week high | $14.55 |
Prev. close | $6.91 | 52-week low | $5.94 |
Day low | $6.62 | Volume | 851,302 |
Day high | $6.85 | Avg. volume | 2,241,436 |
50-day MA | $6.39 | Dividend yield | 11% |
200-day MA | $8.18 | Market Cap | 1.15B |
Brandywine Realty Trust (BDN) Company Bio
Brandywine Realty Trust owns, leases and manages an urban, town center and transit-oriented office portfolio. The company was founded in 1985 and is based in Radnor, Pennsylvania
Latest BDN News From Around the Web
Below are the latest news stories about BRANDYWINE REALTY TRUST that investors may wish to consider to help them evaluate BDN as an investment opportunity.
Brandywine Realty Trust Full Year 2022 Earnings: Beats ExpectationsBrandywine Realty Trust ( NYSE:BDN ) Full Year 2022 Results Key Financial Results Revenue: US$484.1m (up 5.7% from FY... |
Brandywine Realty Trust (BDN) Q4 2022 Earnings Call TranscriptBrandywine Realty Trust (BDN) Q4 2022 Earnings Conference Call February 2, 2023 9:00 AM Company Participants Jerry Sweeney - President and Chief Executive Officer, Trustee Tom Wirth - Executive Vice President and Chief Financial Officer George Johnstone - Executive Vice President, Operations Conference Call Participants Steve Sakwa - Evercore ISI Michael Lewis - Truist Michael Griffin - Citi Tayo Okusanya - Credit Suisse Camille Bonnel - Bank of America Bill Crow - Raymond James Presentation Operator Good day. And thank you for standing by. Welcome to the Brandywine Realty Trust Fourth Quarter 2022 Earnings Call. [Operator... |
Brandywine Realty Trust (BDN) Matches Q4 FFO EstimatesBrandywine Realty Trust (BDN) delivered FFO and revenue surprises of 0% and 0.90%, respectively, for the quarter ended December 2022. Do the numbers hold clues to what lies ahead for the stock? |
Brandywine Realty Trust Announces Fourth Quarter, Full Year 2022 Results and Initiates 2023 GuidancePHILADELPHIA, Feb. 01, 2023 (GLOBE NEWSWIRE) -- Brandywine Realty Trust (NYSE:BDN) today reported its financial and operating results for the three and twelve-month periods ended December 31, 2022. Management Comments “During 2022 we accomplished our 2022 business plan objectives and exceeded our midpoint goals for speculative revenue, same store results and rental rate mark-to-markets,” stated Jerry Sweeney, President and Chief Executive Office of Brandywine Realty Trust. “In addition, since ou |
Why 2023 Is the Year to Apply Buffett's Cigar Butt StrategySmall-cap value stocks are surging |
BDN Price Returns
1-mo | 8.56% |
3-mo | 7.10% |
6-mo | -17.99% |
1-year | -43.29% |
3-year | -47.47% |
5-year | -43.72% |
YTD | 12.67% |
2022 | -50.65% |
2021 | 19.50% |
2020 | -19.06% |
2019 | 28.95% |
2018 | -26.04% |
BDN Dividends
Ex-Dividend Date | Type | Payout Amount | Change | ||||||
---|---|---|---|---|---|---|---|---|---|
Loading, please wait... |
Continue Researching BDN
Want to see what other sources are saying about Brandywine Realty Trust's financials and stock price? Try the links below:Brandywine Realty Trust (BDN) Stock Price | Nasdaq
Brandywine Realty Trust (BDN) Stock Quote, History and News - Yahoo Finance
Brandywine Realty Trust (BDN) Stock Price and Basic Information | MarketWatch
Loading social stream, please wait...