Beam Global (BEEM): Price and Financial Metrics
BEEM Price/Volume Stats
Current price | $11.70 | 52-week high | $21.58 |
Prev. close | $12.04 | 52-week low | $8.51 |
Day low | $11.39 | Volume | 117,200 |
Day high | $12.37 | Avg. volume | 142,600 |
50-day MA | $11.87 | Dividend yield | N/A |
200-day MA | $14.53 | Market Cap | 125.89M |
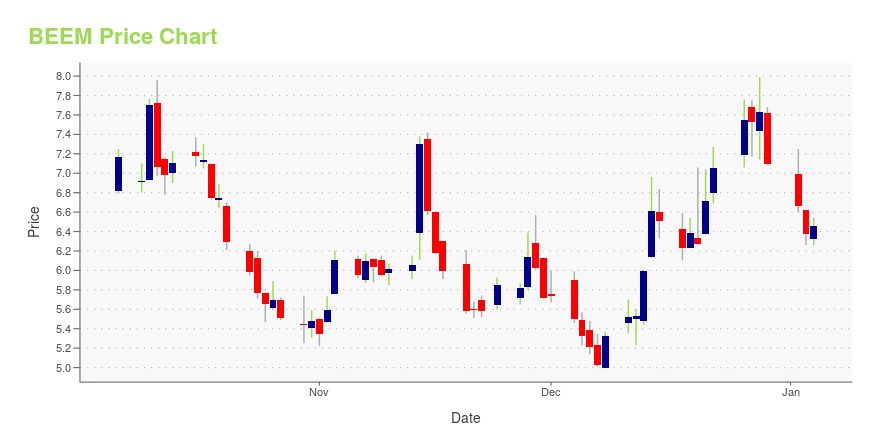
BEEM Stock Price Chart Interactive Chart >
BEEM POWR Grades
- Momentum is the dimension where BEEM ranks best; there it ranks ahead of 57.91% of US stocks.
- BEEM's strongest trending metric is Value; it's been moving up over the last 179 days.
- BEEM's current lowest rank is in the Quality metric (where it is better than 2.51% of US stocks).
BEEM Stock Summary
- With a year-over-year growth in debt of -28.44%, BEAM GLOBAL's debt growth rate surpasses just 11.44% of about US stocks.
- In terms of twelve month growth in earnings before interest and taxes, BEAM GLOBAL is reporting a growth rate of 178.55%; that's higher than 92.33% of US stocks.
- As for revenue growth, note that BEEM's revenue has grown 174.09% over the past 12 months; that beats the revenue growth of 96.04% of US companies in our set.
- Stocks with similar financial metrics, market capitalization, and price volatility to BEAM GLOBAL are PRPO, SGA, PPSI, ESP, and TMST.
- BEEM's SEC filings can be seen here. And to visit BEAM GLOBAL's official web site, go to www.envisionsolar.com.
BEEM Valuation Summary
- In comparison to the median Technology stock, BEEM's price/sales ratio is 73.08% higher, now standing at 4.5.
- BEEM's EV/EBIT ratio has moved up 940 over the prior 159 months.
Below are key valuation metrics over time for BEEM.
Stock | Date | P/S | P/B | P/E | EV/EBIT |
---|---|---|---|---|---|
BEEM | 2023-05-22 | 4.5 | 6.5 | -6.7 | -6.7 |
BEEM | 2023-05-19 | 4.0 | 5.7 | -5.9 | -5.9 |
BEEM | 2023-05-18 | 4.1 | 5.8 | -6.0 | -6.0 |
BEEM | 2023-05-17 | 4.2 | 5.9 | -6.1 | -6.1 |
BEEM | 2023-05-16 | 3.6 | 5.2 | -5.3 | -5.4 |
BEEM | 2023-05-15 | 3.5 | 4.9 | -5.1 | -5.1 |
BEEM Growth Metrics
- The 3 year cash and equivalents growth rate now stands at 10432.14%.
- Its 2 year cash and equivalents growth rate is now at 672.8%.
- Its 5 year price growth rate is now at 16.79%.

The table below shows BEEM's growth in key financial areas (numbers in millions of US dollars).
Date | Revenue | Operating Cash Flow | Net Income to Common Stock |
---|---|---|---|
2022-09-30 | 17.58665 | -16.9701 | -13.88481 |
2022-06-30 | 12.99626 | -10.08106 | -8.784442 |
2022-03-31 | 11.39936 | -7.457924 | -7.62323 |
2021-12-31 | 9.001751 | -6.406707 | -6.596039 |
2021-09-30 | 7.714808 | -6.067417 | -6.917752 |
2021-06-30 | 6.93163 | -5.53206 | -6.329144 |
BEEM's Quality Factors
The “Quality” component of the POWR Ratings focuses on 31 different factors of a companies fundamentals and operational strength. Here are some key insights as we drill into the specifics of these quality attributes.- BEEM has a Quality Grade of F, ranking ahead of 1.17% of graded US stocks.
- BEEM's asset turnover comes in at 0.232 -- ranking 176th of 208 Electronic Equipment stocks.
- REKR, ITI, and VICR are the stocks whose asset turnover ratios are most correlated with BEEM.
The table below shows BEEM's key quality metrics over time.
Period | Asset Turnover | Gross Margin | ROIC |
---|---|---|---|
2021-06-30 | 0.232 | -0.166 | -0.913 |
2021-03-31 | 0.272 | -0.131 | -0.976 |
2020-12-31 | 0.384 | -0.114 | -1.102 |
2020-09-30 | 0.461 | -0.150 | -1.182 |
2020-06-30 | 0.691 | -0.029 | -1.680 |
2020-03-31 | 0.627 | -0.027 | -1.761 |
BEEM Price Target
For more insight on analysts targets of BEEM, see our BEEM price target page. And for a list of of all stocks sorted by upside potential based on analyst target price, see our Top Price Target page.
Average Price Target | $39.75 | Average Broker Recommendation | 1.67 (Moderate Buy) |
Beam Global (BEEM) Company Bio
Beam Global engages in the invention, design, engineering, manufacture, and sale of solar powered products. It offers solar powered products and proprietary technology solutions for electric vehicle charging infrastructure, out of home advertising platforms, and energy security and disaster preparedness. The company was founded by Robert Lane Noble on June 12, 2006 and is headquartered in San Diego, CA.
Latest BEEM News From Around the Web
Below are the latest news stories about BEAM GLOBAL that investors may wish to consider to help them evaluate BEEM as an investment opportunity.
Beam Global to Participate at the B. Riley 23rd Annual Institutional Investor ConferenceSAN DIEGO, May 19, 2023 (GLOBE NEWSWIRE) -- Beam Global, (Nasdaq: BEEM, BEEMW), the leading provider of innovative sustainable products and technologies for electric vehicle (EV) charging, energy storage, energy security and outdoor media, announced today that it will participate at the B. Riley Securities 23rd Annual Institutional Investor Conference on May 24 and May 25, 2023 at the Beverly Hilton Hotel in Beverly Hills, California. Desmond Wheatley, CEO will be holding one-on-one meetings on |
Today’s Biggest Pre-Market Stock Movers: 10 Top Gainers and Losers on TuesdayIt's time to start off the day with a breakdown of all the biggest pre-market stock movers worth keeping an eye on Tuesday! |
EV charging infrastructure capacity 'will be essential' for grid independence: Beam Global CEOBeam Global Chairman of the Board, CEO and President Desmond Wheatley discusses the state of the EV industry and details how charging infrastructure capacity will be an essential aspect of grid independence. |
Beam Global GAAP EPS of -$0.38 beats by $0.07, revenue of $13.02M beats by $4.68M
|
Berkshire Hathaway portfolio, Beam Global, Tesla: Stocks moving in after hoursThe Yahoo Finance Live team breaks down stocks moving in after hours, Beam Global's earnings report, and expectations from Tesla's annual shareholder meeting this week. |
BEEM Price Returns
1-mo | 33.11% |
3-mo | -28.57% |
6-mo | -40.61% |
1-year | -18.12% |
3-year | 46.62% |
5-year | N/A |
YTD | -33.03% |
2022 | -6.08% |
2021 | -74.79% |
2020 | 1,483.26% |
2019 | N/A |
2018 | N/A |
Loading social stream, please wait...