
Berry Global Group, Inc. (BERY): Price and Financial Metrics
BERY Price/Volume Stats
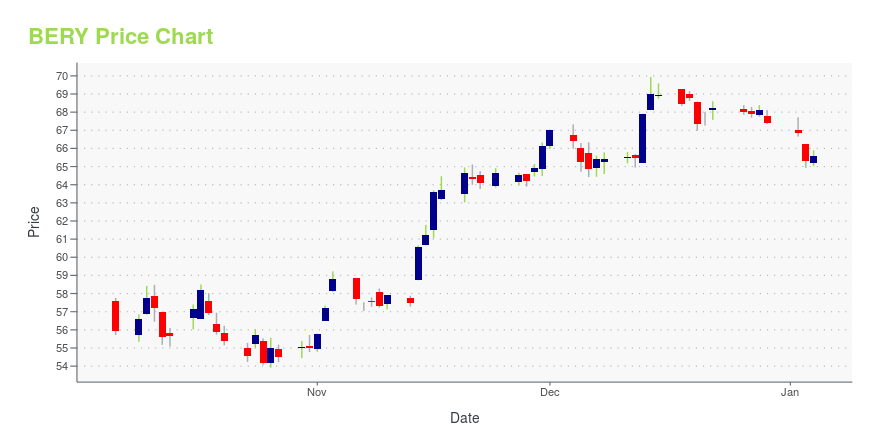
| Current price | $65.05 | 52-week high | $69.93 |
| Prev. close | $63.52 | 52-week low | $53.92 |
| Day low | $63.87 | Volume | 586,765 |
| Day high | $65.21 | Avg. volume | 1,089,382 |
| 50-day MA | $60.57 | Dividend yield | 1.72% |
| 200-day MA | $60.98 | Market Cap | 7.44B |
BERY Stock Price Chart Interactive Chart >
Berry Global Group, Inc. (BERY) Company Bio
Berry Plastics Group manufactures and distributes plastic consumer packaging and engineered materials in North America and internationally. The company operates through four segments: Rigid Open Top, Rigid Closed Top, Engineered Materials, and Flexible Packaging. The company was founded in 1967 and is based in Evansville, Indiana.
Latest BERY News From Around the Web
Below are the latest news stories about BERRY GLOBAL GROUP INC that investors may wish to consider to help them evaluate BERY as an investment opportunity.
Insider Sell: CFO Mark Miles Sells 40,000 Shares of Berry Global Group Inc (BERY)Mark Miles, the Chief Financial Officer of Berry Global Group Inc, has recently sold 40,000 shares of the company's stock on December 4, 2023. |
Is Berry Global Group, Inc. (NYSE:BERY) Potentially Undervalued?While Berry Global Group, Inc. ( NYSE:BERY ) might not be the most widely known stock at the moment, it saw a... |
Insider Sell Alert: Director Carl Rickertsen Sells 18,951 Shares of Berry Global Group IncIn a notable insider transaction, Director Carl Rickertsen has parted with 18,951 shares of Berry Global Group Inc (NYSE:BERY), a significant move that warrants a closer look by investors and market analysts. |
Berry Global (BERY) Gains 12.9% in a Year: Will the Trend Last?Cost-reduction actions and accretive acquisition augur well for Berry Global (BERY). The company's shareholder-friendly policies are promising. |
Insider Sell: Chief Legal Officer Jason Greene Sells Shares of Berry Global Group IncIn the realm of stock market movements, insider trading activity is often a significant indicator that investors keep a close eye on. |
BERY Price Returns
| 1-mo | 7.43% |
| 3-mo | 14.55% |
| 6-mo | -1.69% |
| 1-year | 1.59% |
| 3-year | 4.50% |
| 5-year | 23.07% |
| YTD | -2.56% |
| 2023 | 13.37% |
| 2022 | -17.73% |
| 2021 | 31.30% |
| 2020 | 18.32% |
| 2019 | -0.08% |
BERY Dividends
| Ex-Dividend Date | Type | Payout Amount | Change | ||||||
|---|---|---|---|---|---|---|---|---|---|
| Loading, please wait... | |||||||||
Continue Researching BERY
Here are a few links from around the web to help you further your research on Berry Global Group Inc's stock as an investment opportunity:Berry Global Group Inc (BERY) Stock Price | Nasdaq
Berry Global Group Inc (BERY) Stock Quote, History and News - Yahoo Finance
Berry Global Group Inc (BERY) Stock Price and Basic Information | MarketWatch
Loading social stream, please wait...