
Bright Horizons Family Solutions Inc. (BFAM): Price and Financial Metrics
BFAM Price/Volume Stats
| Current price | $120.36 | 52-week high | $122.67 |
| Prev. close | $117.90 | 52-week low | $71.65 |
| Day low | $117.83 | Volume | 398,300 |
| Day high | $122.31 | Avg. volume | 337,400 |
| 50-day MA | $109.86 | Dividend yield | N/A |
| 200-day MA | $101.53 | Market Cap | 6.98B |
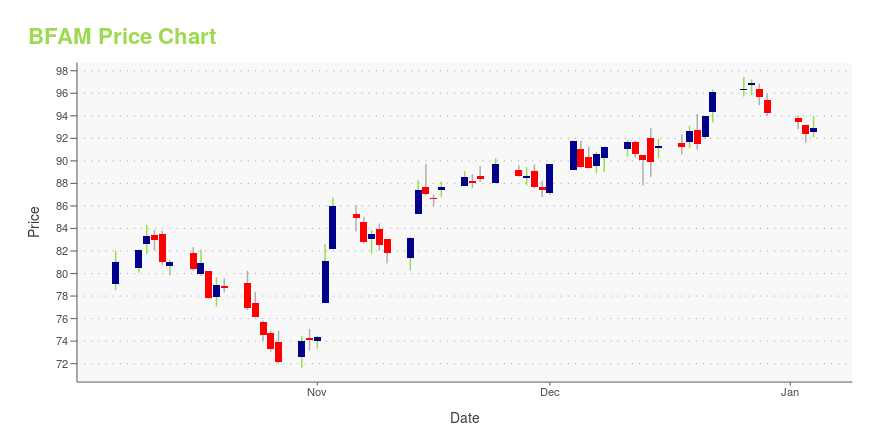
BFAM Stock Price Chart Interactive Chart >
Bright Horizons Family Solutions Inc. (BFAM) Company Bio
Bright Horizons Family Solutions provides child care, early education, and other services for employers and families. It operates through three segments: Full-Service Center-Based Child Care, Back-Up Dependent Care, and Other Educational Advisory Services. The company was founded in 1986 and is based in Watertown, Massachusetts.
Latest BFAM News From Around the Web
Below are the latest news stories about BRIGHT HORIZONS FAMILY SOLUTIONS INC that investors may wish to consider to help them evaluate BFAM as an investment opportunity.
Bright Horizons Stock Adds To Its Rising Relative Strength Rating, Hitting 84Is Bright Horizons Stock A Buy? Bright Horizons stock is trying to complete a consolidation with a 98.87 buy point. Bright Horizons stock earns the No. 9 rank among its peers in the Consumer Services-Education industry group. |
STRA or BFAM: Which Is the Better Value Stock Right Now?STRA vs. BFAM: Which Stock Is the Better Value Option? |
Insider Sell Alert: Director Mary Tocio Sells 5,000 Shares of Bright Horizons Family Solutions ...In a recent transaction on December 11, 2023, Mary Tocio, a director at Bright Horizons Family Solutions Inc (NYSE:BFAM), sold 5,000 shares of the company's stock. |
The past three years for Bright Horizons Family Solutions (NYSE:BFAM) investors has not been profitableFor many investors, the main point of stock picking is to generate higher returns than the overall market. But in any... |
Bright Horizons Stock Shines Amid Return-To-Office Work ParadigmBright Horizons stock shows rising price performance, earning an upgrade to its IBD Relative Strength Rating from 70 to 80. |
BFAM Price Returns
| 1-mo | 12.63% |
| 3-mo | 12.82% |
| 6-mo | 19.17% |
| 1-year | 25.01% |
| 3-year | -21.92% |
| 5-year | -21.84% |
| YTD | 27.72% |
| 2023 | 49.35% |
| 2022 | -49.87% |
| 2021 | -27.23% |
| 2020 | 15.10% |
| 2019 | 34.85% |
Continue Researching BFAM
Want to see what other sources are saying about Bright Horizons Family Solutions Inc's financials and stock price? Try the links below:Bright Horizons Family Solutions Inc (BFAM) Stock Price | Nasdaq
Bright Horizons Family Solutions Inc (BFAM) Stock Quote, History and News - Yahoo Finance
Bright Horizons Family Solutions Inc (BFAM) Stock Price and Basic Information | MarketWatch
Loading social stream, please wait...