
Birks Group Inc. (BGI): Price and Financial Metrics
BGI Price/Volume Stats
| Current price | $2.53 | 52-week high | $5.24 |
| Prev. close | $2.54 | 52-week low | $2.07 |
| Day low | $2.45 | Volume | 2,180 |
| Day high | $2.60 | Avg. volume | 10,867 |
| 50-day MA | $2.66 | Dividend yield | N/A |
| 200-day MA | $3.41 | Market Cap | 47.64M |
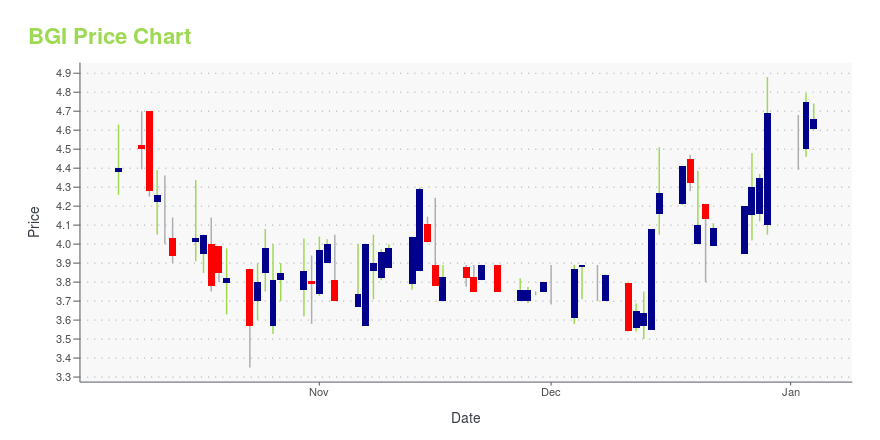
BGI Stock Price Chart Interactive Chart >
Birks Group Inc. (BGI) Company Bio
Birks Group Inc. designs, develops, manufactures, and retails fine jewelry, timepieces, sterling and plated silverware, and gifts in the United States and Canada. The company operates through two segments, Retail and Other. It offers various merchandise, including designer jewelry, diamonds, gemstone and precious metal jewelry, rings, wedding bands, earrings, bracelets, necklaces, charms, and pearls. As of May 31, 2020, the company operated 27 Birks stores under the Maison Birks brand in various metropolitan markets in Canada; 1 retail location under the Brinkhaus brand in Calgary; and 2 retail locations under the Graff and Patek Philippe brands in Vancouver. It also engages in the retail and wholesale of fine jewelry collections through Mappin & Webb and Goldsmiths stores, as well as through e-commerce platforms; and gold exchange business. The company was formerly known as Birks & Mayors Inc. and changed its name to Birks Group Inc. in October 2013. Birks Group Inc. was founded in 1879 and is headquartered in Montreal, Canada.
Latest BGI News From Around the Web
Below are the latest news stories about BIRKS GROUP INC that investors may wish to consider to help them evaluate BGI as an investment opportunity.
BIRKS GROUP REPORTS MID-YEAR FISCAL 2024 RESULTSBirks Group Inc. (the "Company" or "Birks Group") (NYSE American: BGI), today reported its financial results for the twenty-six week period ended September 23, 2023. |
BIRKS GROUP REPORTS FISCAL 2023 RESULTSBirks Group Inc. (the "Company" or "Birks Group") (NYSE American: BGI), today reported its financial results for the fiscal year ended March 25, 2023. |
BIRKS GROUP SADLY ANNOUNCES THE DEATH OF BOARD MEMBER LOUIS ROQUETBirks Group Inc. (the "Company" or "Birks Group") (NYSE American: BGI), announces with great sadness the passing of a member of its Board of Directors, Mr. Louis L. Roquet, on Friday, February 24th, 2023. |
Birks Group Reports FY2023 Holiday Period Sales ResultsMONTREAL, January 23, 2023--Birks Group Inc. (the "Company" or "Birks Group") (NYSE American: BGI), reported its sales results for the 9 week interim sales period ending January 1, 2023 (the "FY2023 Holiday Period") resulting in a decrease of 3.2% in comparable store sales versus the remarkable FY2022 Holiday Period, during which the Company had recorded notable growth of 18.4% in comparable store sales. The FY2023 Holiday Period sales performance is equivalent to an increase in comparable store |
BGI Price Returns
| 1-mo | 1.61% |
| 3-mo | -6.30% |
| 6-mo | -39.47% |
| 1-year | -38.81% |
| 3-year | -9.96% |
| 5-year | 154.27% |
| YTD | -46.06% |
| 2023 | -40.86% |
| 2022 | 63.51% |
| 2021 | 465.27% |
| 2020 | -4.68% |
| 2019 | -5.25% |
Continue Researching BGI
Want to do more research on Birks Group Inc's stock and its price? Try the links below:Birks Group Inc (BGI) Stock Price | Nasdaq
Birks Group Inc (BGI) Stock Quote, History and News - Yahoo Finance
Birks Group Inc (BGI) Stock Price and Basic Information | MarketWatch
Loading social stream, please wait...