
Brighthouse Financial, Inc. (BHF): Price and Financial Metrics
BHF Price/Volume Stats
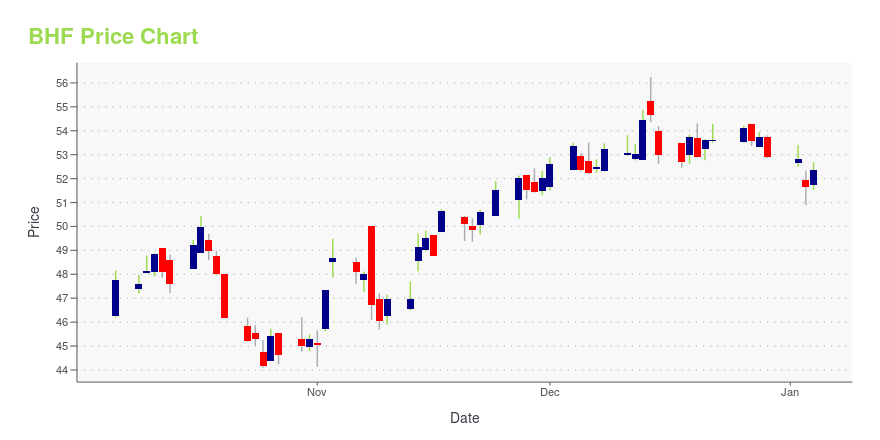
| Current price | $49.10 | 52-week high | $56.24 |
| Prev. close | $48.21 | 52-week low | $40.24 |
| Day low | $48.62 | Volume | 326,317 |
| Day high | $49.28 | Avg. volume | 446,550 |
| 50-day MA | $44.65 | Dividend yield | N/A |
| 200-day MA | $48.35 | Market Cap | 3.05B |
BHF Stock Price Chart Interactive Chart >
Brighthouse Financial, Inc. (BHF) Company Bio
Brighthouse Financial, Inc. provides life insurance and annuity solutions in the United States. It offers shield, variable, guaranteed income builder, income, and fixed annuities; and permanent and term life insurance products. The company was incorporated in 2016 and is based in Charlotte, North Carolina. Brighthouse Financial, Inc. is a subsidiary of MetLife, Inc.
Latest BHF News From Around the Web
Below are the latest news stories about BRIGHTHOUSE FINANCIAL INC that investors may wish to consider to help them evaluate BHF as an investment opportunity.
Here's Why You Should Hold on to Brighthouse Financial (BHF) StockBrighthouse Financial (BHF) is well-poised for improvement on the growing individual insurance market, increasing sales of life insurance products, and a well-diversified and high-quality portfolio. |
Why Is Sun Life (SLF) Up 3% Since Last Earnings Report?Sun Life (SLF) reported earnings 30 days ago. What's next for the stock? We take a look at earnings estimates for some clues. |
Brighthouse Financial Announces Voluntary Sale ProgramCHARLOTTE, N.C., December 11, 2023--Brighthouse Financial, Inc. ("Brighthouse Financial" or the "company") (Nasdaq: BHF) announced today that it will offer a voluntary program through which stockholders owning fewer than 100 shares of Brighthouse Financial’s common stock, as of November 27, 2023, may sell all of their shares. This program allows eligible stockholders to sell their shares in a convenient and efficient manner and helps the company reduce administrative costs. |
Why Is Brighthouse Financial (BHF) Up 11.8% Since Last Earnings Report?Brighthouse Financial (BHF) reported earnings 30 days ago. What's next for the stock? We take a look at earnings estimates for some clues. |
Brighthouse Financial, Inc. (NASDAQ:BHF) is a favorite amongst institutional investors who own 83%Key Insights Institutions' substantial holdings in Brighthouse Financial implies that they have significant influence... |
BHF Price Returns
| 1-mo | 13.53% |
| 3-mo | 0.76% |
| 6-mo | -8.60% |
| 1-year | -4.90% |
| 3-year | 16.30% |
| 5-year | 24.94% |
| YTD | -7.22% |
| 2023 | 3.22% |
| 2022 | -1.02% |
| 2021 | 43.07% |
| 2020 | -7.71% |
| 2019 | 28.71% |
Continue Researching BHF
Want to see what other sources are saying about Brighthouse Financial Inc's financials and stock price? Try the links below:Brighthouse Financial Inc (BHF) Stock Price | Nasdaq
Brighthouse Financial Inc (BHF) Stock Quote, History and News - Yahoo Finance
Brighthouse Financial Inc (BHF) Stock Price and Basic Information | MarketWatch
Loading social stream, please wait...