Braemar Hotels & Resorts Inc. (BHR): Price and Financial Metrics
BHR Price/Volume Stats
Current price | $2.00 | 52-week high | $4.37 |
Prev. close | $2.01 | 52-week low | $1.79 |
Day low | $1.97 | Volume | 369,442 |
Day high | $2.06 | Avg. volume | 289,331 |
50-day MA | $2.17 | Dividend yield | 10.26% |
200-day MA | $2.69 | Market Cap | 133.04M |
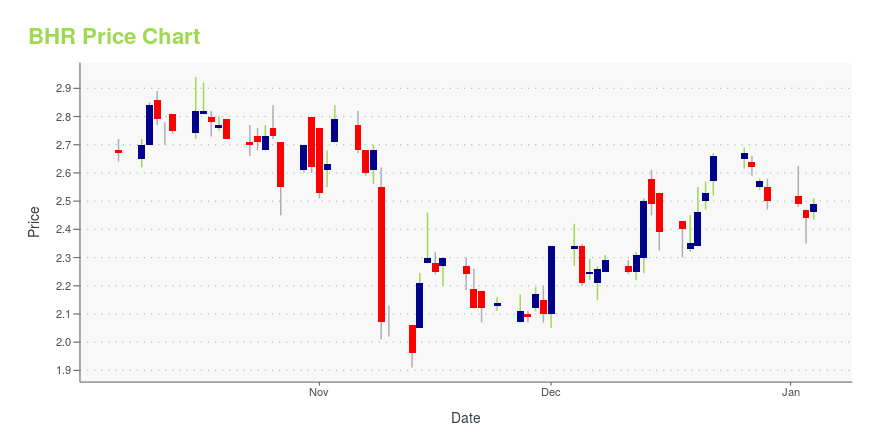
BHR Stock Price Chart Interactive Chart >
BHR POWR Grades
- BHR scores best on the Momentum dimension, with a Momentum rank ahead of 62.22% of US stocks.
- The strongest trend for BHR is in Quality, which has been heading down over the past 26 weeks.
- BHR ranks lowest in Growth; there it ranks in the 4th percentile.
BHR Stock Summary
- Price to trailing twelve month operating cash flow for BHR is currently 2.05, higher than only 5.99% of US stocks with positive operating cash flow.
- Of note is the ratio of BRAEMAR HOTELS & RESORTS INC's sales and general administrative expense to its total operating expenses; only 2.81% of US stocks have a lower such ratio.
- Shareholder yield, a measure of how much is returned to shareholders via dividends and share repurchases, for BHR comes in at 83.37% -- higher than that of 97.82% of stocks in our set.
- Stocks that are quantitatively similar to BHR, based on their financial statements, market capitalization, and price volatility, are MAC, DHC, HPP, AIRC, and PDM.
- Visit BHR's SEC page to see the company's official filings. To visit the company's web site, go to www.bhrreit.com.
BHR Valuation Summary
- In comparison to the median Real Estate stock, BHR's price/sales ratio is 95.83% lower, now standing at 0.2.
- BHR's price/sales ratio has moved down 2 over the prior 124 months.
Below are key valuation metrics over time for BHR.
Stock | Date | P/S | P/B | P/E | EV/EBIT |
---|---|---|---|---|---|
BHR | 2023-12-29 | 0.2 | 0.5 | -2.9 | 15.2 |
BHR | 2023-12-28 | 0.2 | 0.5 | -3.0 | 15.2 |
BHR | 2023-12-27 | 0.2 | 0.5 | -3.1 | 15.3 |
BHR | 2023-12-26 | 0.2 | 0.5 | -3.1 | 15.3 |
BHR | 2023-12-22 | 0.2 | 0.5 | -3.1 | 15.3 |
BHR | 2023-12-21 | 0.2 | 0.5 | -3.0 | 15.2 |
BHR Growth Metrics
- Its year over year revenue growth rate is now at 161.55%.
- Its year over year cash and equivalents growth rate is now at 81.06%.
- The 4 year revenue growth rate now stands at 18.16%.
The table below shows BHR's growth in key financial areas (numbers in millions of US dollars).
Date | Revenue | Operating Cash Flow | Net Income to Common Stock |
---|---|---|---|
2022-09-30 | 628.37 | 112.789 | 0.681 |
2022-09-30 | 628.37 | 112.789 | 3.33 |
2022-06-30 | 583.358 | 112.277 | 8.364 |
2022-03-31 | 505.574 | 80.777 | -17.475 |
2021-12-31 | 427.542 | 63.95 | -40.004 |
2021-09-30 | 348.94 | 40.489 | -64.019 |
BHR's Quality Factors
The “Quality” component of the POWR Ratings focuses on 31 different factors of a companies fundamentals and operational strength. Here are some key insights as we drill into the specifics of these quality attributes.- BHR has a Quality Grade of D, ranking ahead of 5.45% of graded US stocks.
- BHR's asset turnover comes in at 0.163 -- ranking 107th of 443 Trading stocks.
- KIM, SOHO, and APLE are the stocks whose asset turnover ratios are most correlated with BHR.
The table below shows BHR's key quality metrics over time.
Period | Asset Turnover | Gross Margin | ROIC |
---|---|---|---|
2021-06-30 | 0.163 | 0.265 | -0.012 |
2021-03-31 | 0.114 | 0.181 | -0.024 |
2020-12-31 | 0.132 | 0.163 | -0.023 |
2020-09-30 | 0.170 | 0.221 | -0.007 |
2020-06-30 | 0.210 | 0.265 | -0.001 |
2020-03-31 | 0.269 | 0.310 | 0.016 |
BHR Price Target
For more insight on analysts targets of BHR, see our BHR price target page. And for a list of of all stocks sorted by upside potential based on analyst target price, see our Top Price Target page.
Average Price Target | $10.75 | Average Broker Recommendation | 1.5 (Moderate Buy) |
Braemar Hotels & Resorts Inc. (BHR) Company Bio
Braemar Hotels & Resorts (formerly Ashford Hospitality Prime, Inc.) invests primarily in luxury, upper-upscale and upscale hotels. The company operates independently of Ashford Hospitality Trust, Inc. and is based in Dallas, Texas.
Latest BHR News From Around the Web
Below are the latest news stories about BRAEMAR HOTELS & RESORTS INC that investors may wish to consider to help them evaluate BHR as an investment opportunity.
Braemar Hotels & Resorts Inc. (NYSE:BHR) Q3 2023 Earnings Call TranscriptBraemar Hotels & Resorts Inc. (NYSE:BHR) Q3 2023 Earnings Call Transcript November 9, 2023 Operator: Good day, everyone, and welcome to the Braemar Hotels & Resorts Third Quarter 2023 Results Conference Call. Today’s call is being recorded. [Operator Instructions]. I would now like to turn the call over to Jordan Jennings, Director of Investor Relations. […] |
Q3 2023 Braemar Hotels & Resorts Inc Earnings CallQ3 2023 Braemar Hotels & Resorts Inc Earnings Call |
Compared to Estimates, Braemar Hotels & Resorts (BHR) Q3 Earnings: A Look at Key MetricsThe headline numbers for Braemar Hotels & Resorts (BHR) give insight into how the company performed in the quarter ended September 2023, but it may be worthwhile to compare some of its key metrics to Wall Street estimates and the year-ago actuals. |
Braemar Hotels & Resorts: Q3 Earnings SnapshotDALLAS (AP) — Braemar Hotels & Resorts, Inc. (BHR) on Wednesday reported a loss in funds from operations in its third quarter, after reporting a profit in the same period a year earlier. The results fell short of Wall Street expectations. The Dallas-based real estate investment trust said it had a funds from operations loss of $5.4 million, or 8 cents per share, in the period. |
BRAEMAR HOTELS & RESORTS ANNOUNCES UPDATES ON PROPERTY LEVEL MORTGAGESBraemar Hotels & Resorts Inc. (NYSE: BHR) ("Braemar" or the "Company") today announced the Company has finalized extensions for two existing mortgage loans secured by the 170-room Ritz-Carlton Lake Tahoe in Truckee, California and the 210-room Four Seasons Resort Scottsdale at Troon North in North Scottsdale, Arizona. |
BHR Price Returns
1-mo | -9.64% |
3-mo | -17.95% |
6-mo | -24.51% |
1-year | -42.62% |
3-year | -64.36% |
5-year | -80.71% |
YTD | -17.95% |
2023 | -35.17% |
2022 | -17.89% |
2021 | 10.63% |
2020 | -48.38% |
2019 | 7.12% |
BHR Dividends
Ex-Dividend Date | Type | Payout Amount | Change | ||||||
---|---|---|---|---|---|---|---|---|---|
Loading, please wait... |
Continue Researching BHR
Want to do more research on Braemar Hotels & Resorts Inc's stock and its price? Try the links below:Braemar Hotels & Resorts Inc (BHR) Stock Price | Nasdaq
Braemar Hotels & Resorts Inc (BHR) Stock Quote, History and News - Yahoo Finance
Braemar Hotels & Resorts Inc (BHR) Stock Price and Basic Information | MarketWatch
Loading social stream, please wait...