Braemar Hotels & Resorts Inc. (BHR): Price and Financial Metrics
BHR Price/Volume Stats
Current price | $2.75 | 52-week high | $5.60 |
Prev. close | $2.68 | 52-week low | $2.22 |
Day low | $2.71 | Volume | 367,700 |
Day high | $2.79 | Avg. volume | 418,754 |
50-day MA | $2.94 | Dividend yield | 7.3% |
200-day MA | $3.92 | Market Cap | 181.48M |
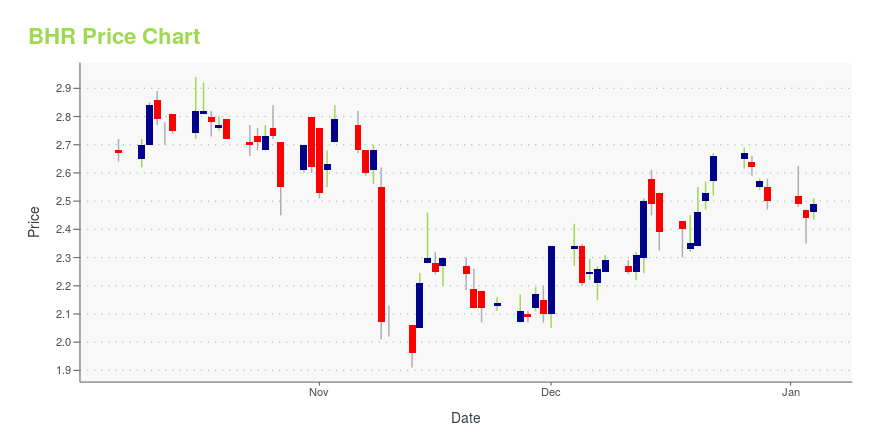
BHR Stock Price Chart Interactive Chart >
BHR POWR Grades
- BHR scores best on the Sentiment dimension, with a Sentiment rank ahead of 74.83% of US stocks.
- The strongest trend for BHR is in Growth, which has been heading down over the past 177 days.
- BHR's current lowest rank is in the Growth metric (where it is better than 9.13% of US stocks).
BHR Stock Summary
- Price to trailing twelve month operating cash flow for BHR is currently 1.97, higher than only 6.57% of US stocks with positive operating cash flow.
- Of note is the ratio of BRAEMAR HOTELS & RESORTS INC's sales and general administrative expense to its total operating expenses; just 3.71% of US stocks have a lower such ratio.
- Shareholder yield, a measure of how much is returned to shareholders via dividends and share repurchases, for BHR comes in at 93.88% -- higher than that of 97.92% of stocks in our set.
- Stocks that are quantitatively similar to BHR, based on their financial statements, market capitalization, and price volatility, are XHR, OHI, HPP, GNL, and AKR.
- Visit BHR's SEC page to see the company's official filings. To visit the company's web site, go to www.bhrreit.com.
BHR Valuation Summary
- In comparison to the median Real Estate stock, BHR's price/earnings ratio is 116.73% lower, now standing at -4.5.
- Over the past 120 months, BHR's EV/EBIT ratio has gone down 22.
Below are key valuation metrics over time for BHR.
Stock | Date | P/S | P/B | P/E | EV/EBIT |
---|---|---|---|---|---|
BHR | 2023-09-20 | 0.2 | 0.5 | -4.5 | 13.9 |
BHR | 2023-09-19 | 0.2 | 0.5 | -4.6 | 13.9 |
BHR | 2023-09-18 | 0.2 | 0.5 | -4.4 | 13.9 |
BHR | 2023-09-15 | 0.3 | 0.5 | -4.8 | 14.0 |
BHR | 2023-09-14 | 0.3 | 0.5 | -4.7 | 14.0 |
BHR | 2023-09-13 | 0.2 | 0.5 | -4.6 | 13.9 |
BHR Growth Metrics
- Its year over year revenue growth rate is now at 161.55%.
- Its year over year cash and equivalents growth rate is now at 81.06%.
- The 4 year revenue growth rate now stands at 18.16%.

The table below shows BHR's growth in key financial areas (numbers in millions of US dollars).
Date | Revenue | Operating Cash Flow | Net Income to Common Stock |
---|---|---|---|
2022-09-30 | 628.37 | 112.789 | 0.681 |
2022-09-30 | 628.37 | 112.789 | 3.33 |
2022-06-30 | 583.358 | 112.277 | 8.364 |
2022-03-31 | 505.574 | 80.777 | -17.475 |
2021-12-31 | 427.542 | 63.95 | -40.004 |
2021-09-30 | 348.94 | 40.489 | -64.019 |
BHR's Quality Factors
The “Quality” component of the POWR Ratings focuses on 31 different factors of a companies fundamentals and operational strength. Here are some key insights as we drill into the specifics of these quality attributes.- BHR has a Quality Grade of D, ranking ahead of 5.45% of graded US stocks.
- BHR's asset turnover comes in at 0.163 -- ranking 107th of 443 Trading stocks.
- KIM, SOHO, and APLE are the stocks whose asset turnover ratios are most correlated with BHR.
The table below shows BHR's key quality metrics over time.
Period | Asset Turnover | Gross Margin | ROIC |
---|---|---|---|
2021-06-30 | 0.163 | 0.265 | -0.012 |
2021-03-31 | 0.114 | 0.181 | -0.024 |
2020-12-31 | 0.132 | 0.163 | -0.023 |
2020-09-30 | 0.170 | 0.221 | -0.007 |
2020-06-30 | 0.210 | 0.265 | -0.001 |
2020-03-31 | 0.269 | 0.310 | 0.016 |
BHR Price Target
For more insight on analysts targets of BHR, see our BHR price target page. And for a list of of all stocks sorted by upside potential based on analyst target price, see our Top Price Target page.
Average Price Target | $10.75 | Average Broker Recommendation | 1.5 (Moderate Buy) |
Braemar Hotels & Resorts Inc. (BHR) Company Bio
Braemar Hotels & Resorts (formerly Ashford Hospitality Prime, Inc.) invests primarily in luxury, upper-upscale and upscale hotels. The company operates independently of Ashford Hospitality Trust, Inc. and is based in Dallas, Texas.
Latest BHR News From Around the Web
Below are the latest news stories about BRAEMAR HOTELS & RESORTS INC that investors may wish to consider to help them evaluate BHR as an investment opportunity.
BRAEMAR HOTELS & RESORTS SETS THIRD QUARTER EARNINGS RELEASE AND CONFERENCE CALL DATESBraemar Hotels & Resorts Inc. (NYSE: BHR) ("Braemar" or the "Company") today announced details for the release of its results for the third quarter ended September 30, 2023. |
Sidoti Events, LLC’s Virtual September Small-Cap ConferenceSidoti Events, LLC, an affiliate of Sidoti & Company, LLC, has released the presentation schedule and weblinks for its two-day September Small-Cap Conference taking place Wednesday and Thursday, September 20-21, 2023. The presentation schedule is subject to change. |
The 5 Best-Performing REITs Under $5Every so often, certain stocks get beaten down so badly, they end up trading in the low single digits. Some stocks never find their way back to higher prices, but others rebound and may allow investors to make significant profits on both appreciation and higher dividend yields. But deciding which low-priced stocks to buy as turnaround plays can be tricky. One of the best ways to determine which ones have the highest probability of being profitable is to look at recent performance as an indicator |
Equity Fund Buys Hersha Hospitality Trust: Hotel REITs Go WildWall Street reporters have a phrase to describe stocks that rise when another stock of the same sector reports excellent news. They write, "Other stocks rose in sympathy." These so-called sympathy stocks don't have any of their own news to propel them higher, but investors surmise that if one stock of a sector reports good news, others of the same ilk may soon follow suit. The result is investors buying shares and pushing the sympathy stock prices higher. This is especially true when a company i |
Braemar Hotels & Resorts among real estate gainers, Avalon GloboCare in losersMore on Real Estate: |
BHR Price Returns
1-mo | -2.74% |
3-mo | -30.33% |
6-mo | -26.50% |
1-year | -34.58% |
3-year | 15.77% |
5-year | -72.84% |
YTD | -30.05% |
2022 | -17.90% |
2021 | 10.63% |
2020 | -48.38% |
2019 | 7.12% |
2018 | -2.16% |
BHR Dividends
Ex-Dividend Date | Type | Payout Amount | Change | ||||||
---|---|---|---|---|---|---|---|---|---|
Loading, please wait... |
Continue Researching BHR
Want to do more research on Braemar Hotels & Resorts Inc's stock and its price? Try the links below:Braemar Hotels & Resorts Inc (BHR) Stock Price | Nasdaq
Braemar Hotels & Resorts Inc (BHR) Stock Quote, History and News - Yahoo Finance
Braemar Hotels & Resorts Inc (BHR) Stock Price and Basic Information | MarketWatch
Loading social stream, please wait...