
TopBuild Corp. (BLD): Price and Financial Metrics
BLD Price/Volume Stats
| Current price | $466.52 | 52-week high | $470.93 |
| Prev. close | $445.10 | 52-week low | $217.08 |
| Day low | $448.13 | Volume | 334,024 |
| Day high | $469.39 | Avg. volume | 281,526 |
| 50-day MA | $410.59 | Dividend yield | N/A |
| 200-day MA | $370.69 | Market Cap | 14.84B |
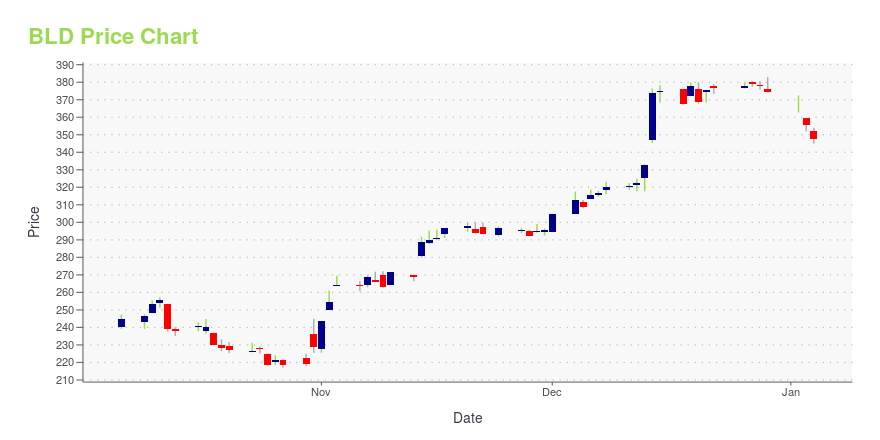
BLD Stock Price Chart Interactive Chart >
TopBuild Corp. (BLD) Company Bio
TopBuild Corporation installs insulation and other building products in the United States. The company operates in two segments, Installation and Distribution. The company was founded in 2015 and is based in Daytona Beach, Florida.
Latest BLD News From Around the Web
Below are the latest news stories about TOPBUILD CORP that investors may wish to consider to help them evaluate BLD as an investment opportunity.
TopBuild (BLD) Is Up 0.40% in One Week: What You Should KnowDoes TopBuild (BLD) have what it takes to be a top stock pick for momentum investors? Let's find out. |
Is TopBuild (BLD) Outperforming Other Construction Stocks This Year?Here is how TopBuild (BLD) and Owens Corning (OC) have performed compared to their sector so far this year. |
Here's Why TopBuild (BLD) is a Strong Growth StockWondering how to pick strong, market-beating stocks for your investment portfolio? Look no further than the Zacks Style Scores. |
5 Top-Ranked Construction Stocks That More Than Doubled the S&PImproving inflation and stable interest rates are likely to contribute to the construction sector, going forward. Let's check why investors are more inclined to DFH, STRL, BLD, IBP and TREX this year. |
Insider Sell: TopBuild Corp's CEO Robert Buck Divests 2,500 SharesTopBuild Corp (NYSE:BLD), a leader in the installation and distribution of insulation and building material products to the U.S. |
BLD Price Returns
| 1-mo | 22.33% |
| 3-mo | 14.60% |
| 6-mo | 27.38% |
| 1-year | 75.36% |
| 3-year | 135.34% |
| 5-year | 475.24% |
| YTD | 24.65% |
| 2023 | 139.16% |
| 2022 | -43.28% |
| 2021 | 49.89% |
| 2020 | 78.58% |
| 2019 | 129.07% |
Continue Researching BLD
Want to see what other sources are saying about TopBuild Corp's financials and stock price? Try the links below:TopBuild Corp (BLD) Stock Price | Nasdaq
TopBuild Corp (BLD) Stock Quote, History and News - Yahoo Finance
TopBuild Corp (BLD) Stock Price and Basic Information | MarketWatch
Loading social stream, please wait...