
BOK Financial Corporation (BOKF): Price and Financial Metrics
BOKF Price/Volume Stats
| Current price | $105.72 | 52-week high | $107.97 |
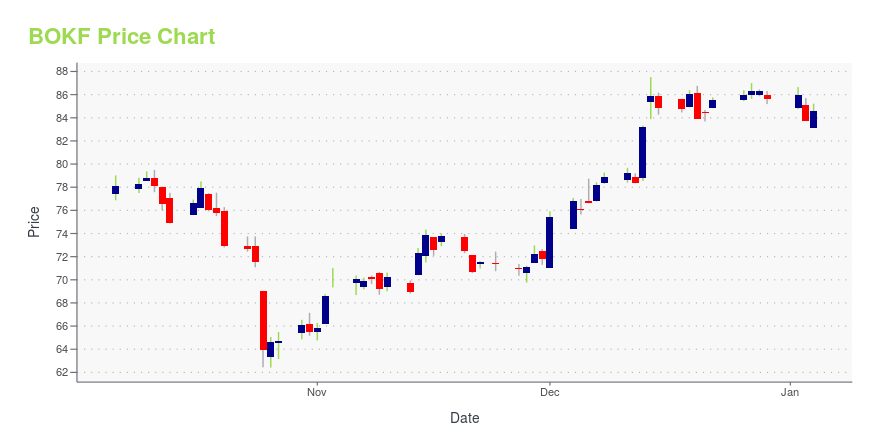
| Prev. close | $105.71 | 52-week low | $62.42 |
| Day low | $105.37 | Volume | 227,400 |
| Day high | $107.50 | Avg. volume | 156,856 |
| 50-day MA | $93.26 | Dividend yield | 2.08% |
| 200-day MA | $85.04 | Market Cap | 6.82B |
BOKF Stock Price Chart Interactive Chart >
BOK Financial Corporation (BOKF) Company Bio
BOK Financial Corporation provides various financial products and services in Oklahoma, Texas, New Mexico, Northwest Arkansas, Colorado, Arizona, and Kansas/Missouri. The company operates through three segments: Commercial Banking, Consumer Banking, and Wealth Management. The company was founded in 1910 and is based in Tulsa, Oklahoma.
Latest BOKF News From Around the Web
Below are the latest news stories about BOK FINANCIAL CORP that investors may wish to consider to help them evaluate BOKF as an investment opportunity.
Natural-Gas Futures Settle Higher Following Storage DrawNatural-gas futures extended gains after the EIA reported an above-estimate draw on inventories for last week. |
BOK Financial (BOKF) Aided by Loan Growth Despite Higher CostsBOK Financial (BOKF) has a strong balance sheet position, with growth in loan and deposit balances over the years. However, an escalation in the cost base is likely to hinder bottom-line growth. |
BOK Financial receives “Outstanding” Community Reinvestment Act RatingCommitment to community core to company valuesTULSA, OK / ACCESSWIRE / December 11, 2023 / BOK Financial has received the highest rating-Outstanding-for its most-recent Community Reinvestment Act (CRA) examination from the Office of the Comptroller ... |
BOK Financial (BOKF) Disposes Insurance Business to USI InsuranceBOK Financial (BOKF) sells its risk management and employee benefits insurance brokerage and consulting business to USI Insurance. It will use sale proceeds to buy higher-yielding securities. |
BOK Financial Corporation Sells Insurance Business to USI Insurance ServicesSale of employee benefits, risk management, and property & casualty business to one of the nation's largest insurance brokerage and consulting firmsTULSA, OK and VALHALLA, NY / ACCESSWIRE / December 1, 2023 / BOK Financial Corporation (NASDAQ:BOKF) ... |
BOKF Price Returns
| 1-mo | 18.15% |
| 3-mo | 17.08% |
| 6-mo | 23.30% |
| 1-year | 21.82% |
| 3-year | 36.07% |
| 5-year | 46.30% |
| YTD | 24.97% |
| 2023 | -15.25% |
| 2022 | 0.59% |
| 2021 | 57.59% |
| 2020 | -18.97% |
| 2019 | 22.09% |
BOKF Dividends
| Ex-Dividend Date | Type | Payout Amount | Change | ||||||
|---|---|---|---|---|---|---|---|---|---|
| Loading, please wait... | |||||||||
Continue Researching BOKF
Want to do more research on Bok Financial Corp Et Al's stock and its price? Try the links below:Bok Financial Corp Et Al (BOKF) Stock Price | Nasdaq
Bok Financial Corp Et Al (BOKF) Stock Quote, History and News - Yahoo Finance
Bok Financial Corp Et Al (BOKF) Stock Price and Basic Information | MarketWatch
Loading social stream, please wait...