Boston Omaha Corporation - (BOMN): Price and Financial Metrics
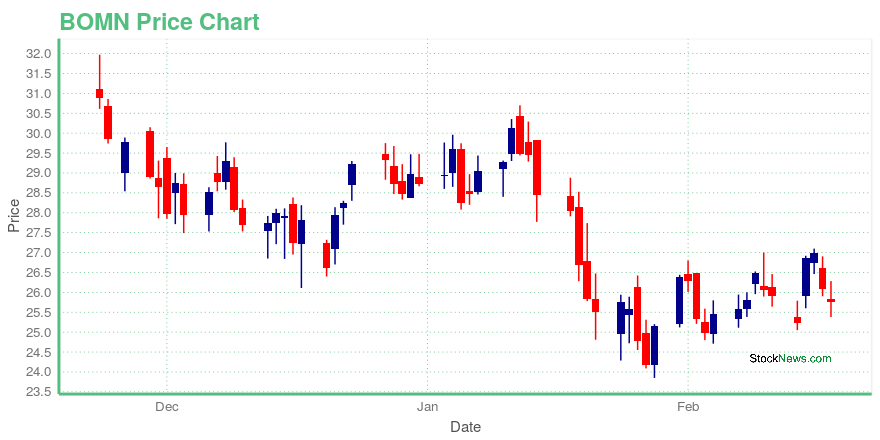
BOMN Price/Volume Stats
| Current price | $25.76 | 52-week high | $49.92 |
| Prev. close | $26.08 | 52-week low | $23.85 |
| Day low | $25.38 | Volume | 86,900 |
| Day high | $26.28 | Avg. volume | 115,644 |
| 50-day MA | $27.25 | Dividend yield | N/A |
| 200-day MA | $0.00 | Market Cap | 761.88M |
BOMN Stock Price Chart Interactive Chart >
Boston Omaha Corporation - (BOMN) Company Bio
Boston Omaha Corporation currently operates three separate lines of business: outdoor billboards, surety insurance and related brokerage activities, and investments in real estate management and related activities. The company was founded in 2015.
BOMN Price Returns
| 1-mo | N/A |
| 3-mo | N/A |
| 6-mo | N/A |
| 1-year | N/A |
| 3-year | N/A |
| 5-year | 62.01% |
| YTD | N/A |
| 2024 | N/A |
| 2023 | N/A |
| 2022 | 0.00% |
| 2021 | 3.91% |
| 2020 | 31.42% |
Continue Researching BOMN
Here are a few links from around the web to help you further your research on BOSTON OMAHA Corp's stock as an investment opportunity:BOSTON OMAHA Corp (BOMN) Stock Price | Nasdaq
BOSTON OMAHA Corp (BOMN) Stock Quote, History and News - Yahoo Finance
BOSTON OMAHA Corp (BOMN) Stock Price and Basic Information | MarketWatch


Loading social stream, please wait...