DMC Global Inc. (BOOM): Price and Financial Metrics

DMC Global Inc. (BOOM): $16.57

0.62 (+3.89%)

POWR Rating

Component Grades

Momentum

C

Stability

C

Sentiment

Quality

B

Add BOOM to Watchlist
Sign Up

Industry: Industrial - Metals

Industry

C

Ranked

#12 of 33

in industry

BOOM Price/Volume Stats

Current price $16.57 52-week high $28.01
Prev. close $15.95 52-week low $14.82
Day low $15.85 Volume 168,607
Day high $16.80 Avg. volume 192,635
50-day MA $19.26 Dividend yield N/A
200-day MA $20.18 Market Cap 327.46M

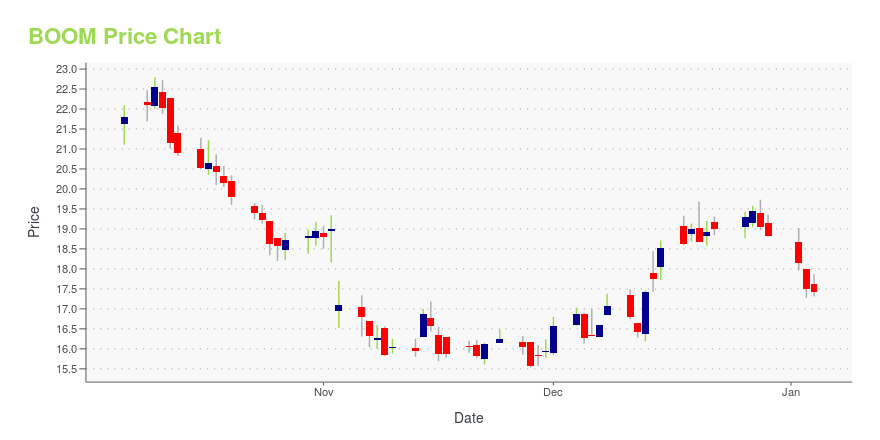
BOOM Stock Price Chart Interactive Chart >

BOOM POWR Grades

  • Quality is the dimension where BOOM ranks best; there it ranks ahead of 85.48% of US stocks.
  • The strongest trend for BOOM is in Stability, which has been heading down over the past 177 days.
  • BOOM ranks lowest in Sentiment; there it ranks in the 10th percentile.

BOOM Stock Summary

  • DMC GLOBAL INC's stock had its IPO on January 5, 1989, making it an older stock than 89.26% of US equities in our set.
  • Over the past twelve months, BOOM has reported earnings growth of 308.95%, putting it ahead of 96.04% of US stocks in our set.
  • As for revenue growth, note that BOOM's revenue has grown 30.75% over the past 12 months; that beats the revenue growth of 83.99% of US companies in our set.
  • Stocks with similar financial metrics, market capitalization, and price volatility to DMC GLOBAL INC are SDPI, JHG, SIDU, CULL, and MTRX.
  • BOOM's SEC filings can be seen here. And to visit DMC GLOBAL INC's official web site, go to www.dmcglobal.com.

BOOM Valuation Summary

  • In comparison to the median Energy stock, BOOM's EV/EBIT ratio is 6.17% lower, now standing at 7.6.
  • Over the past 243 months, BOOM's price/sales ratio has gone up 0.1.

Below are key valuation metrics over time for BOOM.

Stock Date P/S P/B P/E EV/EBIT
BOOM 2023-11-10 0.4 0.8 11.9 7.6
BOOM 2023-11-09 0.4 0.8 11.7 7.5
BOOM 2023-11-08 0.4 0.8 12.0 7.7
BOOM 2023-11-07 0.4 0.8 12.1 7.7
BOOM 2023-11-06 0.5 0.8 12.4 7.9
BOOM 2023-11-03 0.5 0.8 12.6 8.0

BOOM Growth Metrics

    Its 3 year net income to common stockholders growth rate is now at -109.4%.
  • Its year over year price growth rate is now at -59.05%.
  • Its 3 year revenue growth rate is now at -4.48%.
Over the past 70 months, BOOM's revenue has gone up $497,081,000.

The table below shows BOOM's growth in key financial areas (numbers in millions of US dollars).

Date Revenue Operating Cash Flow Net Income to Common Stock
2022-12-31 654.086 44.936 12.247
2022-09-30 550.856 13.429 6.22
2022-06-30 443.566 -4.255 -0.094
2022-03-31 343.173 -19.572 -3.922
2021-12-31 260.115 -12.812 -0.202
2021-09-30 245.384 7.102 1.632

BOOM's Quality Factors

The “Quality” component of the POWR Ratings focuses on 31 different factors of a companies fundamentals and operational strength. Here are some key insights as we drill into the specifics of these quality attributes.
  • BOOM has a Quality Grade of B, ranking ahead of 79.42% of graded US stocks.
  • BOOM's asset turnover comes in at 0.675 -- ranking 29th of 40 Steel Works Etc stocks.
  • CRS, USAP, and ATI are the stocks whose asset turnover ratios are most correlated with BOOM.

The table below shows BOOM's key quality metrics over time.

Period Asset Turnover Gross Margin ROIC
2021-09-30 0.675 0.239 0.009
2021-06-30 0.731 0.238 0.012
2021-03-31 0.771 0.214 -0.041
2020-12-31 0.865 0.248 -0.006
2020-09-30 0.977 0.290 -0.002
2020-06-30 1.129 0.322 0.056

BOOM Price Target

For more insight on analysts targets of BOOM, see our BOOM price target page. And for a list of of all stocks sorted by upside potential based on analyst target price, see our Top Price Target page.

Average Price Target $58.00 Average Broker Recommendation 1.12 (Strong Buy)

DMC Global Inc. (BOOM) Company Bio


Dynamic Materials operates in two sectors: industrial infrastructure and oilfield products and services. The industrial infrastructure sector is served by DMC's NobelClad business, the world's largest manufacturer of explosion-welded clad metal plates, which are used to fabricate capital equipment utilized within various process industries and other industrial sectors. The oilfield products and services sector is served by DynaEnergetics, an international developer, manufacturer and marketer of advanced explosive components and systems used to perforate oil and gas wells. The company was founded in 1965 and is based in Boulder, Colorado.


BOOM Latest News Stream


Event/Time News Detail
Loading, please wait...

BOOM Latest Social Stream


Loading social stream, please wait...

View Full BOOM Social Stream

Latest BOOM News From Around the Web

Below are the latest news stories about DMC GLOBAL INC that investors may wish to consider to help them evaluate BOOM as an investment opportunity.

Implied Volatility Surging for DMC Global (BOOM) Stock Options

Investors need to pay close attention to DMC Global (BOOM) stock based on the movements in the options market lately.

Yahoo | November 20, 2023

James O’Leary Appointed to DMC Global’s Board of Directors

Jim O'Leary Appointed to DMC Global's Board of Directors An image of Jim O'Leary, independent director for DMC Global BROOMFIELD, Colo., Nov. 13, 2023 (GLOBE NEWSWIRE) -- DMC Global Inc. (Nasdaq: BOOM) today announced its board of directors has elected James O’Leary as an independent director. Mr. O’Leary joins the DMC board with nearly four decades of executive leadership, finance and board-level experience, principally in the construction and industrial manufacturing industries. He is on the b

Yahoo | November 13, 2023

DMC Global Inc. (NASDAQ:BOOM) Q3 2023 Earnings Call Transcript

DMC Global Inc. (NASDAQ:BOOM) Q3 2023 Earnings Call Transcript November 5, 2023 Operator: Greetings and welcome to the DMC Global Third Quarter Earnings Call. At this time, all participants are in a listen-only mode. A brief question-and-answer session will follow the formal presentation. [Operator Instructions] As a reminder, this conference is being recorded. It is […]

Yahoo | November 6, 2023

DMC Global (BOOM) Q3 Earnings: How Key Metrics Compare to Wall Street Estimates

While the top- and bottom-line numbers for DMC Global (BOOM) give a sense of how the business performed in the quarter ended September 2023, it could be worth looking at how some of its key metrics compare to Wall Street estimates and year-ago values.

Yahoo | November 2, 2023

DMC Global Inc (BOOM) Reports Q3 2023 Earnings: Adjusted Net Income Up 47% YoY

Despite a 1% decrease in sales, the company's adjusted net income and adjusted EBITDA show significant growth

Yahoo | November 2, 2023

Read More 'BOOM' Stories Here

BOOM Price Returns

1-mo -11.81%
3-mo -34.51%
6-mo -8.55%
1-year -11.11%
3-year -60.43%
5-year -53.93%
YTD -14.76%
2022 -50.92%
2021 -8.42%
2020 -3.27%
2019 28.78%
2018 40.52%

Continue Researching BOOM

Here are a few links from around the web to help you further your research on DMC Global Inc's stock as an investment opportunity:

DMC Global Inc (BOOM) Stock Price | Nasdaq
DMC Global Inc (BOOM) Stock Quote, History and News - Yahoo Finance
DMC Global Inc (BOOM) Stock Price and Basic Information | MarketWatch

Get Free Updates

Join thousands of investors who get the latest news, insights and top rated picks from StockNews.com!