
Boot Barn Holdings, Inc. (BOOT): Price and Financial Metrics
BOOT Price/Volume Stats
| Current price | $129.83 | 52-week high | $134.61 |
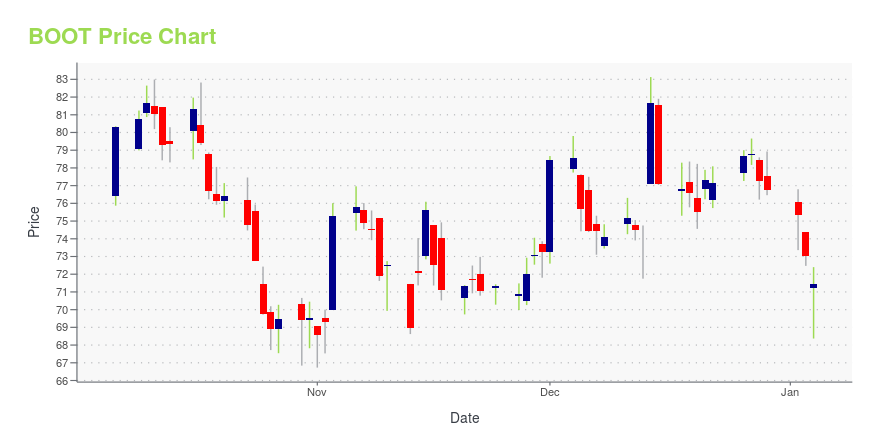
| Prev. close | $122.19 | 52-week low | $66.73 |
| Day low | $123.84 | Volume | 669,836 |
| Day high | $130.59 | Avg. volume | 812,805 |
| 50-day MA | $123.81 | Dividend yield | N/A |
| 200-day MA | $93.90 | Market Cap | 3.95B |
BOOT Stock Price Chart Interactive Chart >
Boot Barn Holdings, Inc. (BOOT) Company Bio
Boot Barn Holdings is a retailer of western and work-related footwear, apparel and accessories for men, women and children. The company was founded in 1978 and is based in Irvine, California.
Latest BOOT News From Around the Web
Below are the latest news stories about BOOT BARN HOLDINGS INC that investors may wish to consider to help them evaluate BOOT as an investment opportunity.
Investors Don't See Light At End Of Boot Barn Holdings, Inc.'s (NYSE:BOOT) TunnelBoot Barn Holdings, Inc.'s ( NYSE:BOOT ) price-to-earnings (or "P/E") ratio of 14.5x might make it look like a buy... |
13 Best Clothing Stocks to Buy NowIn this article, we discuss the 13 best clothing stocks to buy now. If you want to skip our detailed analysis of these stocks, go directly to 5 Best Clothing Stocks to Buy Now. The global clothing industry has had to battle many challenges in 2023. These include high inflation, greater scrutiny over manufacturing processes, […] |
GameStop (GME) Posts Breakeven Earnings & Sales Miss in Q3GameStop (GME) posts weak sales results in third-quarter fiscal 2023 due to lower sales across all its categories. |
AEO vs. BOOT: Which Stock Is the Better Value Option?AEO vs. BOOT: Which Stock Is the Better Value Option? |
Signet (SIG) Q3 Earnings Surpass Estimates, Sales Down Y/YSignet (SIG) posts better-than-expected results for third-quarter fiscal 2024. However, same-store sales dropped 11.8% in the reported quarter. |
BOOT Price Returns
| 1-mo | 1.73% |
| 3-mo | 20.45% |
| 6-mo | 76.09% |
| 1-year | 37.39% |
| 3-year | 55.41% |
| 5-year | 295.58% |
| YTD | 69.14% |
| 2023 | 22.78% |
| 2022 | -49.19% |
| 2021 | 183.79% |
| 2020 | -2.63% |
| 2019 | 161.48% |
Continue Researching BOOT
Want to see what other sources are saying about Boot Barn Holdings Inc's financials and stock price? Try the links below:Boot Barn Holdings Inc (BOOT) Stock Price | Nasdaq
Boot Barn Holdings Inc (BOOT) Stock Quote, History and News - Yahoo Finance
Boot Barn Holdings Inc (BOOT) Stock Price and Basic Information | MarketWatch
Loading social stream, please wait...