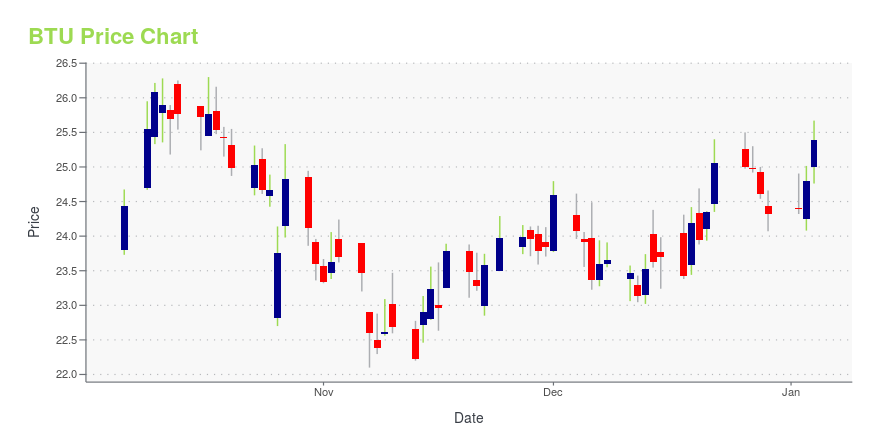
Peabody Energy Corporation (BTU): Price and Financial Metrics
BTU Price/Volume Stats
| Current price | $22.23 | 52-week high | $27.24 |
| Prev. close | $21.86 | 52-week low | $21.00 |
| Day low | $21.81 | Volume | 1,434,600 |
| Day high | $22.24 | Avg. volume | 3,115,168 |
| 50-day MA | $23.04 | Dividend yield | 1.34% |
| 200-day MA | $23.99 | Market Cap | 2.83B |
BTU Stock Price Chart Interactive Chart >
Peabody Energy Corporation (BTU) Company Bio
Peabody Energy is is the largest U.S. coal producer. The company operates through six operating segments: Powder River Basin Mining, Midwestern U.S. Mining, Western U.S. Mining, Australian Metallurgical Mining, Australian Thermal Mining, and Trading and Brokerage. It is involved in mining, preparation, and sale of thermal coal primarily to electric utilities; and metallurgical coal that include hard coking coal, semi-hard coking coal, semi-soft coking coal, and low-volatile pulverized coal injection for industrial customers. The company supplies coal primarily to electricity generators, industrial facilities, and steel manufacturers. The company was founded in 1883 and is based in St. Louis, Missouri.
Latest BTU News From Around the Web
Below are the latest news stories about PEABODY ENERGY CORP that investors may wish to consider to help them evaluate BTU as an investment opportunity.
Peabody Energy, Janus International, and More Stocks See Action From Activist InvestorsActivists file with the SEC on Liquidia, Janus International Group, Peabody Energy, Disc Medicine, and Blue Bird. |
Peabody's North Goonyella Mine Renamed Centurion MinePeabody (NYSE: BTU) today announced that the North Goonyella Mine will now be known as the Centurion Mine. |
12 Most Profitable Cheap Stocks To BuyIn this piece, we will take a look at the 12 most profitable cheap stocks to buy. If you want to skip our coverage of the latest happenings in the renewable energy industry, then you can skip ahead to 5 Most Profitable Cheap Stocks To Buy. As investors seek to exit 2023 with the hopes […] |
Implied Volatility Surging for On Peabody Energy (BTU) Stock OptionsInvestors need to pay close attention to Peabody Energy (BTU) stock based on the movements in the options market lately. |
Are Peabody Energy Corporation (NYSE:BTU) Investors Paying Above The Intrinsic Value?Key Insights Peabody Energy's estimated fair value is US$17.27 based on Dividend Discount Model Current share price of... |
BTU Price Returns
| 1-mo | 1.14% |
| 3-mo | -5.69% |
| 6-mo | -17.28% |
| 1-year | 3.94% |
| 3-year | 120.25% |
| 5-year | 0.85% |
| YTD | -8.00% |
| 2023 | -7.03% |
| 2022 | 162.36% |
| 2021 | 317.84% |
| 2020 | -73.57% |
| 2019 | -67.32% |
BTU Dividends
| Ex-Dividend Date | Type | Payout Amount | Change | ||||||
|---|---|---|---|---|---|---|---|---|---|
| Loading, please wait... | |||||||||
Continue Researching BTU
Want to see what other sources are saying about Peabody Energy Corp's financials and stock price? Try the links below:Peabody Energy Corp (BTU) Stock Price | Nasdaq
Peabody Energy Corp (BTU) Stock Quote, History and News - Yahoo Finance
Peabody Energy Corp (BTU) Stock Price and Basic Information | MarketWatch


Loading social stream, please wait...