Bluegreen Vacations Holding Corp. (BVH): Price and Financial Metrics
GET POWR RATINGS... FREE!
BVH Price/Volume Stats
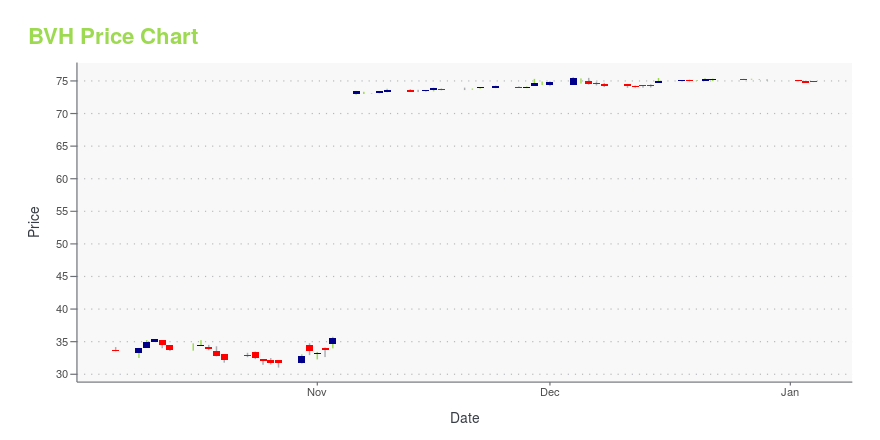
Current price | $29.68 | 52-week high | $34.58 |
Prev. close | $30.27 | 52-week low | $16.24 |
Day low | $29.42 | Volume | 13,117 |
Day high | $30.29 | Avg. volume | 69,405 |
50-day MA | $27.75 | Dividend yield | 2.64% |
200-day MA | $24.93 | Market Cap | 505.69M |
BVH Stock Price Chart Interactive Chart >
BVH POWR Grades
- BVH scores best on the Sentiment dimension, with a Sentiment rank ahead of 97.53% of US stocks.
- The strongest trend for BVH is in Value, which has been heading down over the past 179 days.
- BVH's current lowest rank is in the Growth metric (where it is better than 30.92% of US stocks).
BVH Stock Summary
- BLUEGREEN VACATIONS HOLDING CORP's capital turnover -- a measure of revenue relative to shareholder's equity -- is better than 91.25% of US listed stocks.
- Of note is the ratio of BLUEGREEN VACATIONS HOLDING CORP's sales and general administrative expense to its total operating expenses; 87.33% of US stocks have a lower such ratio.
- Equity multiplier, or assets relative to shareholders' equity, comes in at 6.4 for BLUEGREEN VACATIONS HOLDING CORP; that's greater than it is for 83.28% of US stocks.
- Stocks with similar financial metrics, market capitalization, and price volatility to BLUEGREEN VACATIONS HOLDING CORP are FLO, CNXN, SKX, BKE, and FSV.
- BVH's SEC filings can be seen here. And to visit BLUEGREEN VACATIONS HOLDING CORP's official web site, go to www.bbxcapital.com.
BVH Valuation Summary
- In comparison to the median Consumer Cyclical stock, BVH's price/earnings ratio is 37.31% lower, now standing at 8.4.
- Over the past 243 months, BVH's price/sales ratio has gone down 0.
Below are key valuation metrics over time for BVH.
Stock | Date | P/S | P/B | P/E | EV/EBIT |
---|---|---|---|---|---|
BVH | 2023-05-19 | 0.5 | 2.8 | 8.4 | 8.8 |
BVH | 2023-05-18 | 0.5 | 2.7 | 8.3 | 8.8 |
BVH | 2023-05-17 | 0.5 | 2.7 | 8.1 | 8.7 |
BVH | 2023-05-16 | 0.5 | 2.6 | 7.9 | 8.6 |
BVH | 2023-05-15 | 0.5 | 2.5 | 7.4 | 8.4 |
BVH | 2023-05-12 | 0.5 | 2.4 | 7.2 | 8.3 |
BVH Growth Metrics
- Its 2 year price growth rate is now at 244.9%.
- Its 4 year cash and equivalents growth rate is now at 38.14%.
- Its 5 year net income to common stockholders growth rate is now at -129.73%.

The table below shows BVH's growth in key financial areas (numbers in millions of US dollars).
Date | Revenue | Operating Cash Flow | Net Income to Common Stock |
---|---|---|---|
2022-09-30 | 884.539 | 59.628 | 69.864 |
2022-06-30 | 848.221 | 92.621 | 70.027 |
2022-03-31 | 806.109 | 94.489 | 71.744 |
2021-12-31 | 757.113 | 76.966 | 58.73 |
2021-09-30 | 705.621 | 111.99 | 54.505 |
2021-06-30 | 635.348 | 98.362 | 6.056 |
BVH's Quality Factors
The “Quality” component of the POWR Ratings focuses on 31 different factors of a companies fundamentals and operational strength. Here are some key insights as we drill into the specifics of these quality attributes.- BVH has a Quality Grade of B, ranking ahead of 89.59% of graded US stocks.
- BVH's asset turnover comes in at 0.559 -- ranking 16th of 63 Real Estate stocks.
- UE, HGSH, and GADS are the stocks whose asset turnover ratios are most correlated with BVH.
The table below shows BVH's key quality metrics over time.
Period | Asset Turnover | Gross Margin | ROIC |
---|---|---|---|
2021-09-30 | 0.559 | 0.779 | 0.062 |
2021-06-30 | 0.508 | 0.751 | 0.028 |
2021-03-31 | 0.397 | 0.673 | -0.005 |
2020-12-31 | 0.350 | 0.697 | -0.024 |
2020-09-30 | 0.409 | 0.640 | -0.022 |
2020-06-30 | 0.438 | 0.640 | 0.010 |
BVH Price Target
For more insight on analysts targets of BVH, see our BVH price target page. And for a list of of all stocks sorted by upside potential based on analyst target price, see our Top Price Target page.
Average Price Target | $42.50 | Average Broker Recommendation | 1.5 (Moderate Buy) |
Bluegreen Vacations Holding Corp. (BVH) Company Bio
Bluegreen Vacations Holding Corporation operates as a vacation ownership company. It markets and sells vacation ownership interests (VOI); and manages resorts in leisure and urban destinations, including Orlando, Las Vegas, Myrtle Beach, and Charleston. The company also provides mortgage, VOI title, reservation, and construction design and development services; and financing to qualified VOI purchasers, as well as management services to the vacation club and homeowners' associations. Its resort network includes 45 club resorts and 23 club associate resorts. The company was founded in 1966 and is headquartered in Boca Raton, Florida.
Latest BVH News From Around the Web
Below are the latest news stories about BLUEGREEN VACATIONS HOLDING CORP that investors may wish to consider to help them evaluate BVH as an investment opportunity.
Bluegreen Vacations Expands to NashvilleBOCA RATON, Fla., May 15, 2023--"Nashville has been one of the top desired destinations among our owners," said Dusty Tonkin, Bluegreen’s Chief Sales and Marketing Officer. |
Bluegreen Vacations Holding Corporation (BVH) Upgraded to Strong Buy: What Does It Mean for the Stock?Bluegreen Vacations Holding Corporation (BVH) might move higher on growing optimism about its earnings prospects, which is reflected by its upgrade to a Zacks Rank #1 (Strong Buy). |
Bluegreen Vacations Reports Financial Results for First Quarter 2023BOCA RATON, Fla., May 04, 2023--Bluegreen Vacations Reports Financial Results for First Quarter 2023 |
Bluegreen Vacations Holding Corporation Plans to Issue Financial Results for the First Quarter of 2023 on May 4thBOCA RATON, Fla., April 26, 2023--Bluegreen Vacations Holding Corporation Plans to Issue Financial Results for the First Quarter of 2023 on May 4th |
Will Bluegreen Vacations Holding Corporation (BVH) Beat Estimates Again in Its Next Earnings Report?Bluegreen Vacations Holding Corporation (BVH) has an impressive earnings surprise history and currently possesses the right combination of the two key ingredients for a likely beat in its next quarterly report. |
BVH Price Returns
1-mo | 3.09% |
3-mo | -8.20% |
6-mo | 37.17% |
1-year | N/A |
3-year | 240.05% |
5-year | N/A |
YTD | 19.64% |
2022 | -27.52% |
2021 | 159.42% |
2020 | -43.12% |
2019 | N/A |
2018 | N/A |
BVH Dividends
Ex-Dividend Date | Type | Payout Amount | Change | ||||||
---|---|---|---|---|---|---|---|---|---|
Loading, please wait... |
Loading social stream, please wait...