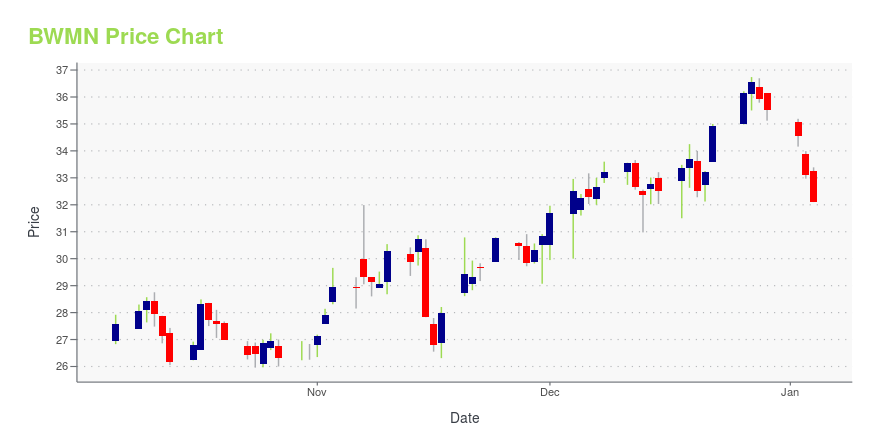
Bowman Consulting Group Ltd., (BWMN): Price and Financial Metrics
GET POWR RATINGS... FREE!
BWMN POWR Grades
- Sentiment is the dimension where BWMN ranks best; there it ranks ahead of 98.95% of US stocks.
- BWMN's strongest trending metric is Value; it's been moving down over the last 131 days.
- BWMN's current lowest rank is in the Value metric (where it is better than 15.07% of US stocks).
BWMN Stock Summary
- With a one year PEG ratio of 0.46, BOWMAN CONSULTING GROUP LTD is expected to have a higher PEG ratio (a measure of how expensive a stock is relative to its expected earnings growth) than only 4.22% of US stocks.
- BWMN's went public 1.74 years ago, making it older than only 5.53% of listed US stocks we're tracking.
- With a price/earnings ratio of 104.9, BOWMAN CONSULTING GROUP LTD P/E ratio is greater than that of about 95.17% of stocks in our set with positive earnings.
- Stocks with similar financial metrics, market capitalization, and price volatility to BOWMAN CONSULTING GROUP LTD are COCO, MORN, SMID, WHG, and KIDS.
- BWMN's SEC filings can be seen here. And to visit BOWMAN CONSULTING GROUP LTD's official web site, go to www.bowman.com.
BWMN Valuation Summary
- BWMN's price/sales ratio is 1.4; this is 7.69% higher than that of the median Industrials stock.
- BWMN's price/sales ratio has moved up 0.4 over the prior 21 months.
Below are key valuation metrics over time for BWMN.
Stock | Date | P/S | P/B | P/E | EV/EBIT |
---|---|---|---|---|---|
BWMN | 2023-01-24 | 1.4 | 2.8 | 99.1 | 832.6 |
BWMN | 2023-01-23 | 1.4 | 2.7 | 96.5 | 812.1 |
BWMN | 2023-01-20 | 1.4 | 2.7 | 97.1 | 816.9 |
BWMN | 2023-01-19 | 1.3 | 2.6 | 93.6 | 789.6 |
BWMN | 2023-01-18 | 1.3 | 2.6 | 92.7 | 782.4 |
BWMN | 2023-01-17 | 1.3 | 2.6 | 92.0 | 776.3 |
BWMN Price Target
For more insight on analysts targets of BWMN, see our BWMN price target page. And for a list of of all stocks sorted by upside potential based on analyst target price, see our Top Price Target page.
Average Price Target | $19.00 | Average Broker Recommendation | 1.5 (Moderate Buy) |
BWMN Stock Price Chart Interactive Chart >
BWMN Price/Volume Stats
Current price | $24.95 | 52-week high | $25.80 |
Prev. close | $25.49 | 52-week low | $10.76 |
Day low | $24.95 | Volume | 45,400 |
Day high | $25.80 | Avg. volume | 50,848 |
50-day MA | $21.04 | Dividend yield | N/A |
200-day MA | $16.43 | Market Cap | 331.88M |
Bowman Consulting Group Ltd., (BWMN) Company Bio
Bowman Consulting Group Ltd., a consulting company, provides a range of real estate, energy, infrastructure, and environmental management solutions in the United States. It offers civil and site engineering services, such as conceptual land planning, environmental consulting and permitting, planning/zoning and entitlements, roadway and highway designs, erosion and sediment designs, stormwater management designs, construction administration, traffic studies, floodplain studies, and utility relocation designs; and commissioning and energy efficiency services comprise construction observation, direct systems functional performance testing, system development readiness checklist, post occupancy review, review of construction documents, deferred/seasonal functional testing, final commissioning report, and commissioning review of submittals. The company also provides construction management services, including constructability review, value engineering, budgeting and cost estimating, interagency and utility coordination, onsite observation and report evaluation, public communication and outreach, and resident engineer services, as well as bid solicitation, documentation, and preparation services; and environmental consulting services consisting of wetlands and waters of the U.S. delineations, natural resources inventories, wildlife and vegetation surveys, threatened and endangered species surveys, endangered species conservation and management, wetland creation and enhancement design, NEPA documentation, section 404/401 permitting and compliance, NPDES permitting, and phase I environmental site assessment. In addition, it offers landscape architecture, land procurement and right-of-way acquisition, structural engineering, surveying and geospatial engineering, and transportation and water resources engineering services, as well as mechanical, electrical, and plumbing engineering services. The company was incorporated in 1995 and is headquartered in Reston, Virginia.
Latest BWMN News From Around the Web
Below are the latest news stories about BOWMAN CONSULTING GROUP LTD that investors may wish to consider to help them evaluate BWMN as an investment opportunity.
Bowman Consulting (BWMN) is on the Move, Here's Why the Trend Could be SustainableBowman Consulting (BWMN) could be a solid choice for shorter-term investors looking to capitalize on the recent price trend in fundamentally sound stocks. It is one of the many stocks that passed through our shorter-term trading strategy-based screen. |
Zacks Industry Outlook Highlights Viad, Bowman Consulting Group and BGSFViad, Bowman Consulting Group and BGSF are part of the Zacks Industry Outlook article. |
Some Investors May Be Worried About Bowman Consulting Group's (NASDAQ:BWMN) Returns On CapitalWhat are the early trends we should look for to identify a stock that could multiply in value over the long term... |
Are Business Services Stocks Lagging Bowman Consulting Group (BWMN) This Year?Here is how Bowman Consulting (BWMN) and UiPath (PATH) have performed compared to their sector so far this year. |
Bowman’s Geospatial Division Delivers Advanced LiDAR Ceiling Scanning Techniques to Cuhaci Peterson to Enable Commercial Design EfficiencyRESTON, Va., January 17, 2023--Bowman Consulting Group Ltd. (collectively with its subsidiaries, the "Company" or "Bowman") (NASDAQ: BWMN) announced that Cuhaci Peterson™, a nationally-recognized architecture and engineering firm, has teamed with Bowman’s geospatial division to deliver time and cost savings for their clients by utilizing Bowman’s minimally invasive ceiling scanning techniques. |
BWMN Price Returns
1-mo | 21.71% |
3-mo | 64.69% |
6-mo | 78.21% |
1-year | 46.68% |
3-year | N/A |
5-year | N/A |
YTD | 14.19% |
2022 | 2.85% |
2021 | N/A |
2020 | N/A |
2019 | N/A |
2018 | N/A |
Loading social stream, please wait...