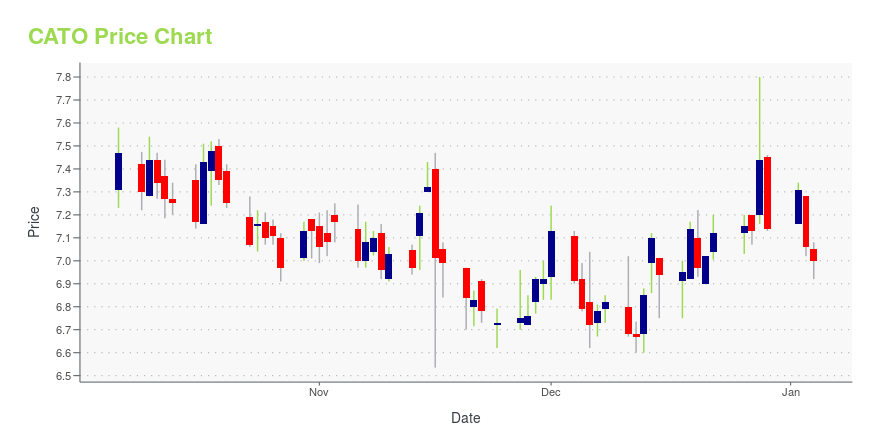
Cato Corporation (The) (CATO): Price and Financial Metrics
CATO Price/Volume Stats
Current price | $7.66 | 52-week high | $12.11 |
Prev. close | $7.82 | 52-week low | $7.22 |
Day low | $7.30 | Volume | 262,600 |
Day high | $7.95 | Avg. volume | 86,801 |
50-day MA | $7.90 | Dividend yield | 8.11% |
200-day MA | $8.60 | Market Cap | 157.71M |
CATO Stock Price Chart Interactive Chart >
CATO POWR Grades
- Value is the dimension where CATO ranks best; there it ranks ahead of 84.19% of US stocks.
- The strongest trend for CATO is in Quality, which has been heading up over the past 177 days.
- CATO ranks lowest in Momentum; there it ranks in the 33rd percentile.
CATO Stock Summary
- CATO's went public 36.45 years ago, making it older than 92.32% of listed US stocks we're tracking.
- With a price/sales ratio of 0.22, CATO CORP has a higher such ratio than merely 7.67% of stocks in our set.
- In terms of twelve month growth in earnings before interest and taxes, CATO CORP is reporting a growth rate of -135.84%; that's higher than just 10.52% of US stocks.
- Stocks with similar financial metrics, market capitalization, and price volatility to CATO CORP are NUS, SSNT, GCO, CTRN, and JCTCF.
- CATO's SEC filings can be seen here. And to visit CATO CORP's official web site, go to www.catofashions.com.
CATO Valuation Summary
- CATO's price/earnings ratio is -79.7; this is 631.33% lower than that of the median Consumer Cyclical stock.
- CATO's price/sales ratio has moved down 0.5 over the prior 243 months.
Below are key valuation metrics over time for CATO.
Stock | Date | P/S | P/B | P/E | EV/EBIT |
---|---|---|---|---|---|
CATO | 2023-09-13 | 0.2 | 0.7 | -79.7 | -54.0 |
CATO | 2023-09-12 | 0.2 | 0.7 | -80.8 | -54.5 |
CATO | 2023-09-11 | 0.2 | 0.7 | -81.9 | -55.0 |
CATO | 2023-09-08 | 0.2 | 0.7 | -81.9 | -55.0 |
CATO | 2023-09-07 | 0.2 | 0.7 | -83.7 | -55.8 |
CATO | 2023-09-06 | 0.2 | 0.7 | -83.3 | -55.6 |
CATO Growth Metrics
- Its 5 year cash and equivalents growth rate is now at -42.28%.
- Its 5 year price growth rate is now at -53.03%.
- Its year over year cash and equivalents growth rate is now at 15.56%.

The table below shows CATO's growth in key financial areas (numbers in millions of US dollars).
Date | Revenue | Operating Cash Flow | Net Income to Common Stock |
---|---|---|---|
2022-09-30 | 756.438 | -0.324 | -3.443 |
2022-06-30 | 752.025 | -5.193 | 9.613 |
2022-03-31 | 762.907 | 14.523 | 25.879 |
2021-12-31 | 769.271 | 59.788 | 36.844 |
2021-09-30 | 748.462 | 74.765 | 35.035 |
2021-06-30 | 727.04 | 99.476 | 22.81 |
CATO's Quality Factors
The “Quality” component of the POWR Ratings focuses on 31 different factors of a companies fundamentals and operational strength. Here are some key insights as we drill into the specifics of these quality attributes.- CATO has a Quality Grade of B, ranking ahead of 78.85% of graded US stocks.
- CATO's asset turnover comes in at 1.216 -- ranking 112th of 165 Retail stocks.
- ULTA, DBI, and BURL are the stocks whose asset turnover ratios are most correlated with CATO.
The table below shows CATO's key quality metrics over time.
Period | Asset Turnover | Gross Margin | ROIC |
---|---|---|---|
2021-07-31 | 1.216 | 0.373 | 0.034 |
2021-05-01 | 1.147 | 0.312 | -0.020 |
2021-01-30 | 0.951 | 0.247 | -0.119 |
2020-10-31 | 0.972 | 0.264 | -0.102 |
2020-08-01 | 1.012 | 0.296 | -0.071 |
2020-05-02 | 1.056 | 0.344 | -0.031 |
Cato Corporation (The) (CATO) Company Bio
The Cato Corporation operates as a specialty retailer of fashion apparel and accessories in the Southeastern United States. The company was founded in 1946 and is based in Charlotte, North Carolina.
Latest CATO News From Around the Web
Below are the latest news stories about CATO CORP that investors may wish to consider to help them evaluate CATO as an investment opportunity.
Cato's (NYSE:CATO) Dividend Will Be $0.17The Cato Corporation ( NYSE:CATO ) has announced that it will pay a dividend of $0.17 per share on the 25th of... |
THE CATO CORPORATION ANNOUNCES REGULAR QUARTERLY DIVIDENDThe Board of Directors of The Cato Corporation (NYSE: CATO) declared a regular quarterly dividend of $0.17 per share. The dividend will be payable on September 25, 2023 to shareholders of record on September 11, 2023. |
CATO REPORTS 2Q RESULTSThe Cato Corporation (NYSE: CATO) today reported net income of $1.1 million or $0.06 per diluted share for the second quarter ended July 29, 2023, compared to a net loss of $2.3 million or ($0.11) per diluted share for the second quarter ended July 30, 2022. |
12 High-Dividend Stocks to Buy Under $10In this article, we discuss high-dividend stocks to buy under $10. You can skip our detailed analysis of dividend stocks and their performance over the years, and go directly to read 5 High-Dividend Stocks to Buy Under $10. Dividend stocks offer advantages beyond just income generation, benefiting both regular investors and those seeking a steady […] |
A Look At The Intrinsic Value Of The Cato Corporation (NYSE:CATO)Key Insights Using the Dividend Discount Model, Cato fair value estimate is US$7.17 With US$8.11 share price, Cato... |
CATO Price Returns
1-mo | 1.08% |
3-mo | -2.45% |
6-mo | -8.19% |
1-year | -12.90% |
3-year | 14.05% |
5-year | -47.61% |
YTD | -12.57% |
2022 | -42.20% |
2021 | 84.02% |
2020 | -43.53% |
2019 | 32.97% |
2018 | -2.99% |
CATO Dividends
Ex-Dividend Date | Type | Payout Amount | Change | ||||||
---|---|---|---|---|---|---|---|---|---|
Loading, please wait... |
Continue Researching CATO
Want to see what other sources are saying about Cato Corp's financials and stock price? Try the links below:Cato Corp (CATO) Stock Price | Nasdaq
Cato Corp (CATO) Stock Quote, History and News - Yahoo Finance
Cato Corp (CATO) Stock Price and Basic Information | MarketWatch
Loading social stream, please wait...