CymaBay Therapeutics Inc. (CBAY): Price and Financial Metrics
CBAY Price/Volume Stats
| Current price | $32.48 | 52-week high | $32.50 |
| Prev. close | $32.47 | 52-week low | $7.26 |
| Day low | $32.48 | Volume | 8,356,200 |
| Day high | $32.50 | Avg. volume | 4,113,430 |
| 50-day MA | $28.59 | Dividend yield | N/A |
| 200-day MA | $18.42 | Market Cap | 3.73B |
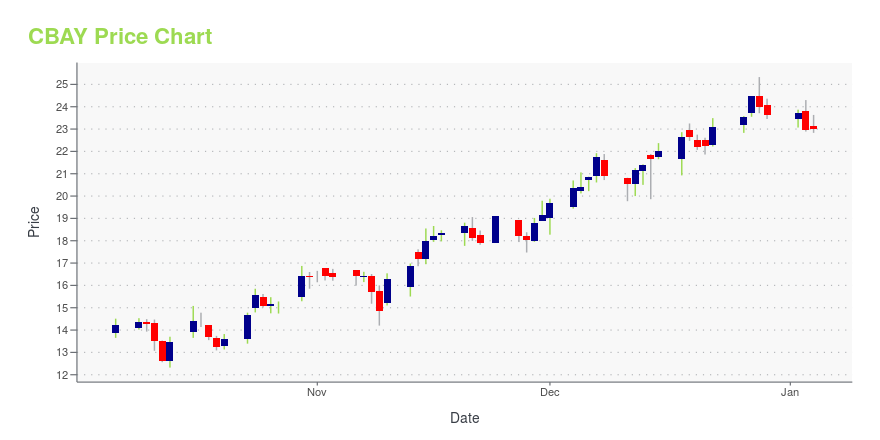
CBAY Stock Price Chart Interactive Chart >
CymaBay Therapeutics Inc. (CBAY) Company Bio
Cymabay Therapeutics, Inc. focuses on developing therapies to treat metabolic diseases. The company was formerly known as Metabolex, Inc. The company was founded in 1988 and is based in Newark, California.
CBAY Price Returns
| 1-mo | N/A |
| 3-mo | N/A |
| 6-mo | N/A |
| 1-year | 35.39% |
| 3-year | 1,023.88% |
| 5-year | 1,609.47% |
| YTD | N/A |
| 2024 | 0.00% |
| 2023 | 276.71% |
| 2022 | 85.50% |
| 2021 | -41.11% |
| 2020 | 192.86% |


Loading social stream, please wait...