Cboe Global Markets Inc. (CBOE): Price and Financial Metrics

Cboe Global Markets Inc. (CBOE): $157.10

1.78 (+1.15%)

POWR Rating

Component Grades

Momentum

B

Stability

B

Sentiment

Quality

C

Add CBOE to Watchlist
Sign Up

Industry: Financial Marketplaces

Industry

D

Ranked

#5 of 12

in industry

CBOE Price/Volume Stats

Current price $157.10 52-week high $158.71
Prev. close $155.32 52-week low $114.17
Day low $155.19 Volume 587,000
Day high $157.42 Avg. volume 653,649
50-day MA $147.84 Dividend yield 1.42%
200-day MA $134.94 Market Cap 16.58B

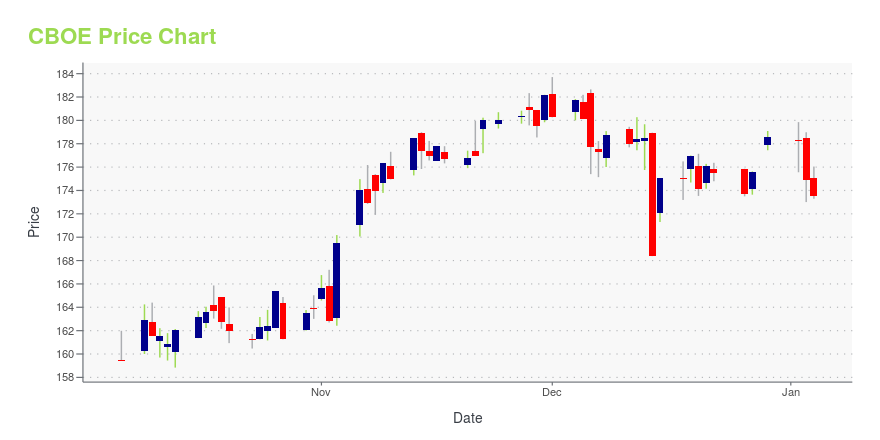
CBOE Stock Price Chart Interactive Chart >

CBOE POWR Grades

  • CBOE scores best on the Momentum dimension, with a Momentum rank ahead of 89.64% of US stocks.
  • CBOE's strongest trending metric is Growth; it's been moving down over the last 179 days.
  • CBOE ranks lowest in Value; there it ranks in the 15th percentile.

CBOE Stock Summary

  • CBOE GLOBAL MARKETS INC's market capitalization of $16,006,906,904 is ahead of 88.34% of US-listed equities.
  • Price to trailing twelve month operating cash flow for CBOE is currently 28.92, higher than 86.08% of US stocks with positive operating cash flow.
  • Over the past twelve months, CBOE has reported earnings growth of 153.51%, putting it ahead of 91.51% of US stocks in our set.
  • Stocks with similar financial metrics, market capitalization, and price volatility to CBOE GLOBAL MARKETS INC are H, CLH, DY, SYNH, and OIS.
  • CBOE's SEC filings can be seen here. And to visit CBOE GLOBAL MARKETS INC's official web site, go to www.cboe.com.

CBOE Valuation Summary

  • CBOE's EV/EBIT ratio is 16.8; this is 48.67% higher than that of the median Financial Services stock.
  • CBOE's EV/EBIT ratio has moved up 0.6 over the prior 161 months.

Below are key valuation metrics over time for CBOE.

Stock Date P/S P/B P/E EV/EBIT
CBOE 2023-09-15 4.0 4.3 24.3 16.8
CBOE 2023-09-14 4.1 4.3 24.5 17.0
CBOE 2023-09-13 4.1 4.4 24.7 17.1
CBOE 2023-09-12 4.2 4.4 24.9 17.2
CBOE 2023-09-11 4.2 4.5 25.2 17.4
CBOE 2023-09-08 4.1 4.4 24.9 17.2

CBOE Growth Metrics

    The 2 year cash and equivalents growth rate now stands at 299.15%.
  • The 2 year net cashflow from operations growth rate now stands at 85.44%.
  • Its 2 year net income to common stockholders growth rate is now at 14.56%.
CBOE's revenue has moved up $1,142,400,000 over the prior 34 months.

The table below shows CBOE's growth in key financial areas (numbers in millions of US dollars).

Date Revenue Operating Cash Flow Net Income to Common Stock
2022-12-31 3,958.5 651.1 234.1
2022-09-30 3,820.2 106.1 239.6
2022-06-30 3,643.5 500.4 210
2022-03-31 3,458.5 1,257.5 499.7
2021-12-31 3,494.8 596.8 527.3
2021-09-30 3,472.6 1,554.8 449.1

CBOE's Quality Factors

The “Quality” component of the POWR Ratings focuses on 31 different factors of a companies fundamentals and operational strength. Here are some key insights as we drill into the specifics of these quality attributes.
  • CBOE has a Quality Grade of C, ranking ahead of 39.28% of graded US stocks.
  • CBOE's asset turnover comes in at 0.493 -- ranking 43rd of 444 Trading stocks.
  • SITC, UNIT, and GNL are the stocks whose asset turnover ratios are most correlated with CBOE.

The table below shows CBOE's key quality metrics over time.

Period Asset Turnover Gross Margin ROIC
2021-09-30 0.493 0.401 0.401
2021-06-30 0.518 0.381 0.419
2021-03-31 0.564 0.359 0.434
2020-12-31 0.591 0.366 0.469
2020-09-30 0.584 0.386 0.495
2020-06-30 0.591 0.401 0.488

Cboe Global Markets Inc. (CBOE) Company Bio


Cboe Global Markets is an American company that owns the Chicago Board Options Exchange and the stock exchange operator BATS Global Markets. (Source:Wikipedia)  


CBOE Latest News Stream


Event/Time News Detail
Loading, please wait...

CBOE Latest Social Stream


Loading social stream, please wait...

View Full CBOE Social Stream

Latest CBOE News From Around the Web

Below are the latest news stories about CBOE GLOBAL MARKETS INC that investors may wish to consider to help them evaluate CBOE as an investment opportunity.

Cboe Global (CBOE) Stock Surges 24% YTD: More Upside Left?

Strong market position, global reach, strength in its proprietary products and solid capital position continue to drive Cboe Global (CBOE) shares.

Yahoo | September 22, 2023

Cboe CEO Ed Tilly Rose From Trading Pit to Exit in Scandal

(Bloomberg) -- When Ed Tilly walked onto the Chicago Board Options Exchange floor in 1987 — where trading pits teemed with sweaty men barking orders and flashing signals — the recent college graduate was hooked. Most Read from BloombergVegas’ Newest Resort Is a $3.7 Billion Palace, 23 Years in the MakingFed Set to Pause Rate Hikes, But Don’t Count Out Another IncreaseTrudeau’s Murder Claim Risks Upending US Courtship of IndiaStocks Fall as Yields Rise on Fed’s ‘Hawkish Skip’: Markets WrapDollar

Yahoo | September 20, 2023

Are Same-Day Expiry Options Really Pushing Market Makers Into A Corner? Cboe Says: "No"

In an insightful recent article, Cboe Global Markets Inc. (BATS:CBOE) explores the rise of same-day expiry options - dubbed "0DTE options" - and their impact on volatility and institutional operations.

Yahoo | September 20, 2023

Cboe CEO resigns for undisclosed relationships, following BP, CNN and McDonald’s bosses ousted over keeping quiet on personal involvement with colleagues

Cboe announced Edward Tilly's resignation in a statement on Tuesday following an investigation that determined the CEO's lack of transparency 'stands in stark contrast to the company’s values'.

Yahoo | September 20, 2023

Cboe Global Markets CEO resigns over undisclosed personal relationships

Edward Tilly, the CEO of Cboe Global Markets (NYSE:CBOE), resigned from his position on Tuesday following an investigation into undisclosed personal relationships with colleagues. This investigation was initiated in late August by the board of directors and an external independent counsel. The company's shares closed 2.8% higher at $155.87 following the announcement.

Yahoo | September 20, 2023

Read More 'CBOE' Stories Here

CBOE Price Returns

1-mo 4.26%
3-mo 17.89%
6-mo 20.11%
1-year 37.36%
3-year 84.59%
5-year 65.91%
YTD 26.63%
2022 -2.16%
2021 42.23%
2020 -21.17%
2019 24.16%
2018 -20.60%

CBOE Dividends

Ex-Dividend Date Type Payout Amount Change
Loading, please wait...
View Full CBOE Dividend History

Get Free Updates

Join thousands of investors who get the latest news, insights and top rated picks from StockNews.com!