
CBRE Group Inc. CI A (CBRE): Price and Financial Metrics
CBRE Price/Volume Stats
| Current price | $110.55 | 52-week high | $112.21 |
| Prev. close | $107.43 | 52-week low | $64.63 |
| Day low | $108.57 | Volume | 3,578,100 |
| Day high | $112.21 | Avg. volume | 1,676,748 |
| 50-day MA | $90.83 | Dividend yield | N/A |
| 200-day MA | $86.67 | Market Cap | 33.92B |
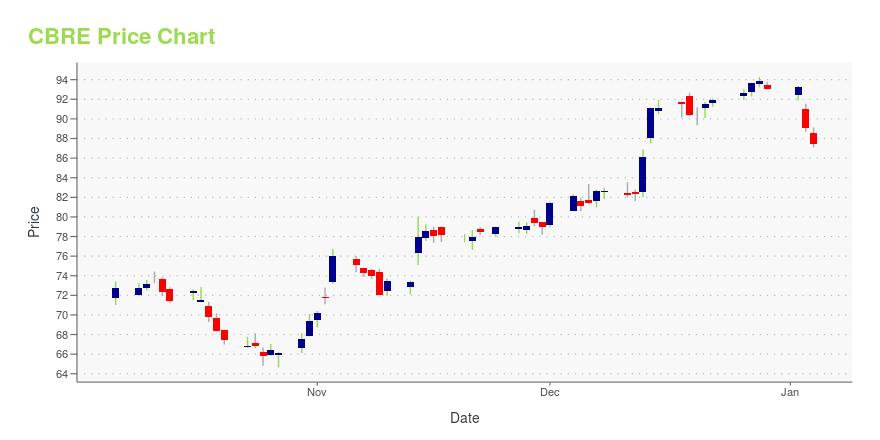
CBRE Stock Price Chart Interactive Chart >
CBRE Group Inc. CI A (CBRE) Company Bio
CBRE Group, Inc. is an American commercial real estate services and investment firm. The abbreviation CBRE stands for Coldwell Banker Richard Ellis. It is the largest commercial real estate services company in the world. (Source:Wikipedia)
Latest CBRE News From Around the Web
Below are the latest news stories about CBRE GROUP INC that investors may wish to consider to help them evaluate CBRE as an investment opportunity.
New Strong Sell Stocks for December 28thALTO, BANC and CBRE have been added to the Zacks Rank #5 (Strong Sell) List on December 28, 2023. |
Dubai’s Red-Hot Property Market Is Bracing for a Slowdown(Bloomberg) -- Just nine months after buying their first property in Dubai, Dina Habib and Karim Yusuf are already planning their next move within the city. Most Read from BloombergThe Late-Night Email to Tim Cook That Set the Apple Watch Saga in MotionChinese Carmaker Overtakes Tesla as World’s Most Popular EV MakerTesla Plans Revamp of Smash Hit Model Y From China PlantS&P 500 Rally Flashes Signs of Fatigue Near Record: Markets WrapApple Resumes Sale of Watches After Appeals Court Lifts US Ban |
Capital Markets Poised for Return to Normalcy in 2024: ReportA return to normalcy appears on the way for commercial real estate capital markets. Brokerage CBRE (CBRE), argues in its “U.S. Real Estate Outlook 2024” report that real estate values will eventually stabilize mid-year and that investment volume will edge closer to pre-pandemic numbers. “There is a bit more real estate pain ahead, but stabilization and the early stages of recovery aren’t far behind that,” said Richard Barkham, CBRE global chief economist and global head of research. |
MainStay CBRE Global Infrastructure Megatrends Term Fund (NYSE: MEGI) Declares Monthly Distribution for December 2023 and Availability of 19(a) NoticeMainStay CBRE Global Infrastructure Megatrends Term Fund (the "Fund") (NYSE: MEGI) today announced the Fund's monthly distributions for December 2023 of $0.1250 per common share. The Fund's current annualized distribution rate is 11.80% based upon the closing price of $12.71 on December 12, 2023, and 10.07% based upon the Fund's closing NAV of $14.90 as of the same date. |
Europe Real Estate Facing €176 Billion Debt Refinance Shortfall(Bloomberg) -- A wall of real estate debt is coming due across Europe in the next four years and more than a quarter of it may not be refinanced, according to CBRE Group Inc.Most Read from BloombergJPMorgan Is in a Fight Over Its Client’s Lost $50 Million FortuneTesla Recalls 2 Million Cars to Fix Autopilot Safety FlawsGoldman Trader Paid $100 Million Since 2020 Is Stepping DownArgentina’s Milei Devalues Peso by 54% in First Batch of Shock MeasuresCOP28 Nations Reach First-Ever Deal to Move Away |
CBRE Price Returns
| 1-mo | 24.92% |
| 3-mo | 26.59% |
| 6-mo | 25.81% |
| 1-year | 34.16% |
| 3-year | 21.48% |
| 5-year | 108.62% |
| YTD | 18.76% |
| 2023 | 20.96% |
| 2022 | -29.08% |
| 2021 | 73.01% |
| 2020 | 2.33% |
| 2019 | 53.07% |
Continue Researching CBRE
Here are a few links from around the web to help you further your research on Cbre Group Inc's stock as an investment opportunity:Cbre Group Inc (CBRE) Stock Price | Nasdaq
Cbre Group Inc (CBRE) Stock Quote, History and News - Yahoo Finance
Cbre Group Inc (CBRE) Stock Price and Basic Information | MarketWatch
Loading social stream, please wait...