
CBIZ, Inc. (CBZ): Price and Financial Metrics
CBZ Price/Volume Stats
| Current price | $85.66 | 52-week high | $86.04 |
| Prev. close | $83.55 | 52-week low | $49.15 |
| Day low | $84.92 | Volume | 245,792 |
| Day high | $85.79 | Avg. volume | 295,629 |
| 50-day MA | $77.26 | Dividend yield | N/A |
| 200-day MA | $68.75 | Market Cap | 4.29B |
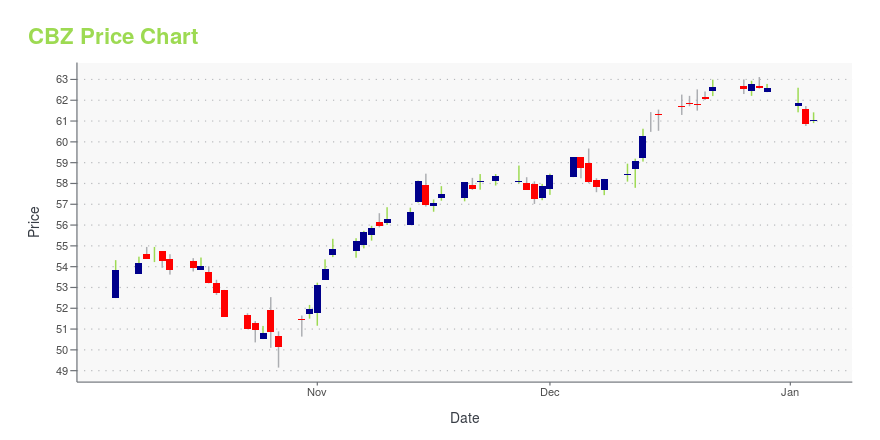
CBZ Stock Price Chart Interactive Chart >
CBIZ, Inc. (CBZ) Company Bio
CBIZ Inc. provides professional business services, products, and solutions in the United States and Canada. It offers its services through three practice groups: Financial Services, Employee Services, and National Practices. The company was founded in 1987 and is based in Cleveland, Ohio.
Latest CBZ News From Around the Web
Below are the latest news stories about CBIZ INC that investors may wish to consider to help them evaluate CBZ as an investment opportunity.
20 Countries with Highest Income Tax Rates in the WorldIn this article, we will look at 20 countries with highest income tax rates in the world. If you want to skip our detailed analysis, head straight to 5 Countries with Highest Income Tax Rates in the World. Governments run on taxes, which is one of the major means of capital generation for a state. […] |
CBIZ, Inc.'s (NYSE:CBZ) Share Price Not Quite Adding UpCBIZ, Inc.'s ( NYSE:CBZ ) price-to-earnings (or "P/E") ratio of 24.9x might make it look like a sell right now compared... |
Small Business Hiring Experiences Flat Reading in NovemberCLEVELAND, December 12, 2023--The CBIZ Small Business Employment Index ("SBEI") reported a seasonally adjusted increase of 0.15% in November after experiencing two consecutive months of declines in hiring. The CBIZ SBEI tracks payroll and hiring trends for over 3,100 companies that have 300 or fewer employees, providing broad insight into small business trends. |
20 Tax-Friendly States for High Income in the USIn this article, we will look at the 20 tax-friendly states for high income in the US. If you want to skip our detailed analysis, head straight to 5 Tax-Friendly States for High Income in the US. Individual Income Taxes Individual income taxes are a key source for state governments to generate revenue. State policies […] |
CBIZ Appointed to International Benefits Network Global CouncilCLEVELAND, November 30, 2023--CBIZ, Inc., the leading provider of professional advisory services, focused on accounting, benefits and insurance, HR and payroll solutions, is honored to be a member of the International Benefits Network ("IBN"), a global network of independent employee benefits and wellbeing consulting firms in over 80 countries. CBIZ has also now been appointed to the prestigious IBN Global Council which is responsible for the overall strategy and leadership of the member Network |
CBZ Price Returns
| 1-mo | 16.20% |
| 3-mo | 17.73% |
| 6-mo | 31.52% |
| 1-year | 66.49% |
| 3-year | 175.43% |
| 5-year | 278.19% |
| YTD | 36.86% |
| 2023 | 33.60% |
| 2022 | 19.76% |
| 2021 | 47.01% |
| 2020 | -1.30% |
| 2019 | 36.85% |
Continue Researching CBZ
Here are a few links from around the web to help you further your research on CBIZ Inc's stock as an investment opportunity:CBIZ Inc (CBZ) Stock Price | Nasdaq
CBIZ Inc (CBZ) Stock Quote, History and News - Yahoo Finance
CBIZ Inc (CBZ) Stock Price and Basic Information | MarketWatch
Loading social stream, please wait...