
CECO Environmental Corp. (CECE): Price and Financial Metrics
CECE Price/Volume Stats
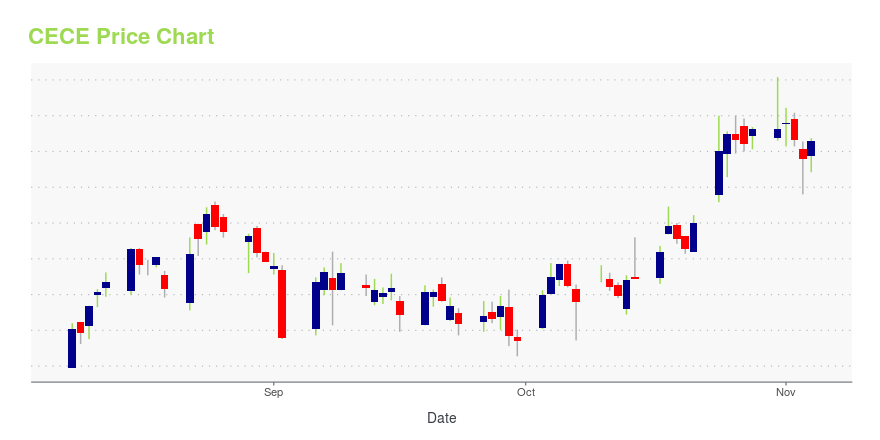
| Current price | $11.65 | 52-week high | $12.54 |
| Prev. close | $11.40 | 52-week low | $4.09 |
| Day low | $11.21 | Volume | 201,400 |
| Day high | $11.69 | Avg. volume | 202,754 |
| 50-day MA | $10.06 | Dividend yield | N/A |
| 200-day MA | $7.18 | Market Cap | 401.91M |
CECE Stock Price Chart Interactive Chart >
CECO Environmental Corp. (CECE) Company Bio
CECO Environmental Corporation provides a wide spectrum of products and services including dampers & diverters, cyclonic technology, thermal oxidizers, filtration systems, scrubbers, fluid handling equipment and plant engineered services and engineered design build fabrication. The company was founded in 1966 and is based in Cincinnati, Ohio.
Latest CECE News From Around the Web
Below are the latest news stories about CECO ENVIRONMENTAL CORP that investors may wish to consider to help them evaluate CECE as an investment opportunity.
CECO Environmental to Change Nasdaq Ticker Symbol to 'CECO' on Nov. 7CECO Environmental Corp. (Nasdaq: CECE) ("CECO"), a leading environmentally focused, diversified industrial company whose solutions protect people, the environment, and industrial equipment, today announced its ticker symbol on the Nasdaq stock market will change from "CECE" to "CECO" at the open of market trading on Monday, Nov. 7, 2022. |
CECO Environmental (NASDAQ:CECE) Will Be Looking To Turn Around Its ReturnsWhat financial metrics can indicate to us that a company is maturing or even in decline? A business that's potentially... |
CECE or DCI: Which Is the Better Value Stock Right Now?CECE vs. DCI: Which Stock Is the Better Value Option? |
Is CECO Environmental (CECE) Outperforming Other Industrial Products Stocks This Year?Here is how CECO Environmental (CECE) and Greif (GEF) have performed compared to their sector so far this year. |
CECO ENVIRONMENTAL TO RELEASE THIRD QUARTER 2022 EARNINGS AND HOST CONFERENCE CALL ON NOVEMBER 7CECO Environmental Corp. (Nasdaq: CECE), a leading environmentally focused, diversified industrial company whose solutions protect people, the environment and industrial equipment, today announced it will report its third quarter 2022 financial results on Monday, Nov. 7, 2022, premarket. The Company will also host an earnings conference call starting at 8:30 a.m. Eastern Time (7:30 a.m. CT). |
CECE Price Returns
| 1-mo | N/A |
| 3-mo | N/A |
| 6-mo | N/A |
| 1-year | N/A |
| 3-year | 65.95% |
| 5-year | 29.59% |
| YTD | N/A |
| 2023 | N/A |
| 2022 | 0.00% |
| 2021 | -10.49% |
| 2020 | -9.14% |
| 2019 | 13.48% |
Continue Researching CECE
Want to see what other sources are saying about Ceco Environmental Corp's financials and stock price? Try the links below:Ceco Environmental Corp (CECE) Stock Price | Nasdaq
Ceco Environmental Corp (CECE) Stock Quote, History and News - Yahoo Finance
Ceco Environmental Corp (CECE) Stock Price and Basic Information | MarketWatch
Loading social stream, please wait...