
Comstock Holding Companies, Inc. - (CHCI): Price and Financial Metrics
CHCI Price/Volume Stats
| Current price | $6.32 | 52-week high | $8.56 |
| Prev. close | $6.33 | 52-week low | $3.85 |
| Day low | $6.30 | Volume | 3,008 |
| Day high | $6.57 | Avg. volume | 15,892 |
| 50-day MA | $6.43 | Dividend yield | N/A |
| 200-day MA | $5.35 | Market Cap | 62.09M |
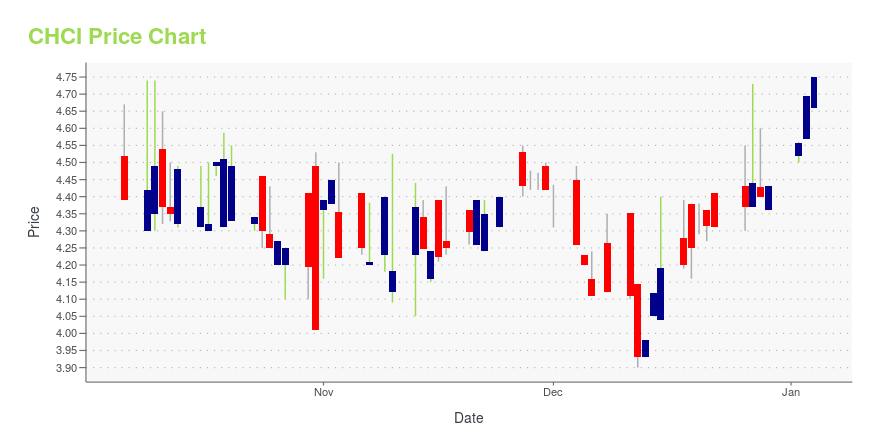
CHCI Stock Price Chart Interactive Chart >
Latest CHCI News From Around the Web
Below are the latest news stories about COMSTOCK HOLDING COMPANIES INC that investors may wish to consider to help them evaluate CHCI as an investment opportunity.
Comstock Reports Third Quarter 2023 ResultsRESTON, Va., November 09, 2023--Comstock Holding Companies, Inc. (Nasdaq: CHCI) ("Comstock" or the "Company"), a leading asset manager, developer, and operator of mixed-use and transit-oriented properties in the Washington, D.C. region, announced its financial results for the third quarter ended September 30, 2023. |
Are Strong Financial Prospects The Force That Is Driving The Momentum In Comstock Holding Companies, Inc.'s NASDAQ:CHCI) Stock?Comstock Holding Companies' (NASDAQ:CHCI) stock is up by a considerable 23% over the past three months. Given that the... |
TF Cornerstone acquires Reston office building, next to properties where it has existing plansA New York firm has acquired a Reston office building for what looks like a bargain, adding to its existing properties next door, where it already has — or at least had recently — plans for redevelopment in the works. New York City's TF Cornerstone Inc. recently announced its purchase of the 1990s-era, five-story, roughly 250,000-square-foot office at 1881 Campus Commons Drive for $25.1 million, the deal having closed Wednesday. The property sits adjacent to twin 1980s-era offices, each about 120,000 square feet, at 1900 and 1902 Campus Commons Drive, which TF Cornerstone picked up for $71.5 million in 2015. |
Comstock Announces Two Additional Restaurants Coming to Reston StationRESTON, Va., September 19, 2023--Comstock Holding Companies, Inc. (Nasdaq: CHCI) ("Comstock"), a leading asset manager, developer, and operator of mixed-use and transit-oriented properties in the Washington, D.C. region, announced today the signing of two restaurant leases for the Reston Row District at Reston Station: Noku Sushi, a Virginia-based fast casual sushi and ramen restaurant, and Tous les Jour, a popular bakery chain. Both leases will occupy ground-level retail space at 1800 Reston Ro |
Comstock Appoints former JBGS Executive David Paul to Board of DirectorsRESTON, Va., September 06, 2023--Comstock Holding Companies, Inc. (Nasdaq: CHCI) ("Comstock" or the "Company"), a leading asset manager, developer, and operator of mixed-use and transit-oriented properties in the Washington, D.C. region, announced today that David P. Paul has been appointed to its Board of Directors and will serve an initial term that expires at the Company’s 2024 Annual Meeting of Stockholders. |
CHCI Price Returns
| 1-mo | 0.96% |
| 3-mo | -11.36% |
| 6-mo | 32.77% |
| 1-year | 29.51% |
| 3-year | 10.88% |
| 5-year | 175.98% |
| YTD | 42.61% |
| 2023 | 4.28% |
| 2022 | -12.37% |
| 2021 | 53.00% |
| 2020 | 62.02% |
| 2019 | 16.46% |
Continue Researching CHCI
Want to do more research on Comstock Holding Companies Inc's stock and its price? Try the links below:Comstock Holding Companies Inc (CHCI) Stock Price | Nasdaq
Comstock Holding Companies Inc (CHCI) Stock Quote, History and News - Yahoo Finance
Comstock Holding Companies Inc (CHCI) Stock Price and Basic Information | MarketWatch
Loading social stream, please wait...