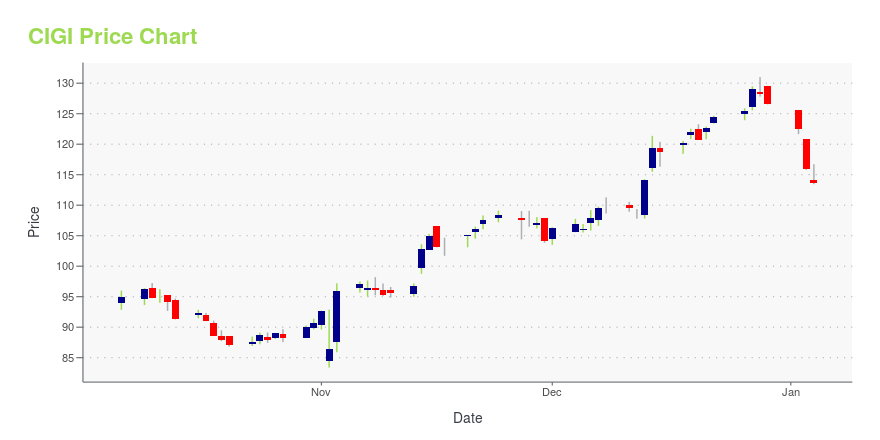
Colliers International Group Inc. (CIGI): Price and Financial Metrics
CIGI Price/Volume Stats
| Current price | $139.43 | 52-week high | $140.30 |
| Prev. close | $136.09 | 52-week low | $83.38 |
| Day low | $137.12 | Volume | 106,338 |
| Day high | $140.30 | Avg. volume | 113,037 |
| 50-day MA | $115.89 | Dividend yield | 0.23% |
| 200-day MA | $112.50 | Market Cap | 6.82B |
CIGI Stock Price Chart Interactive Chart >
Colliers International Group Inc. (CIGI) Company Bio
Colliers International Group provides a full range of services to real estate occupiers, owners and investors worldwide. Services include brokerage, global corporate solutions, investment sales and capital markets, project management and workplace solutions, property and asset management, consulting, valuation and appraisal services, and customized research and thought leadership. The company was founded in 1972 and is based in Toronto, Canada.
Latest CIGI News From Around the Web
Below are the latest news stories about COLLIERS INTERNATIONAL GROUP INC that investors may wish to consider to help them evaluate CIGI as an investment opportunity.
The Miami Area’s Office Market as 2023 Ends: Cooling, But Still HotAs it has elsewhere, the volume of office building sales has cratered in Greater Miami as interest rates have climbed. Plus, vacancy rates are uneven across submarkets, with vacancy ranging from 7.5 percent along Brickell Avenue to more than 20 percent in Downtown Miami. Consider Eighteen Sunset, a new five-story office building that will open soon in the Sunset Harbour neighborhood on the west side of Miami Beach, with amenities that include unobstructed views of the Miami skyline across Biscayne Bay. |
Colliers International Group Inc.'s (TSE:CIGI) Revenues Are Not Doing Enough For Some InvestorsWith a price-to-sales (or "P/S") ratio of 1.3x Colliers International Group Inc. ( TSE:CIGI ) may be sending bullish... |
Nation’s Top Industrial Markets Show Signs of Strength Amid Economic AdversityAmerica’s top industrial boom towns are weathering the economic headwinds better than the national market as a whole, according to new research by Colliers (CIGI). Demand for industrial space nationwide has cooled this year as new construction and investment sales calm down. “Really, it’s returning to what we saw prior to the pandemic,” Hurvitz said. |
Colliers joins the World Green Building Council’s Net Zero Carbon Buildings CommitmentAdvancing sustainability efforts by targeting whole life carbon and use of 100% renewable energy in own operationsTORONTO, Dec. 07, 2023 (GLOBE NEWSWIRE) -- With bold action needed to prevent the worst effects of climate change, leading diversified professional services and investment management company Colliers (NASDAQ and TSX: CIGI) has signed the World Green Building Council’s (WGBC) Net Zero Carbon Buildings Commitment, which calls for emissions from buildings globally to be halved by 2030, |
Colliers declares semi-annual dividendTORONTO, Dec. 05, 2023 (GLOBE NEWSWIRE) -- Colliers International Group Inc. (TSX and NASDAQ: CIGI) ("Colliers") announced today that its Board of Directors has declared a semi-annual cash dividend on the outstanding Subordinate Voting Shares and Multiple Voting Shares (together, the "Common Shares") of US$0.15 per Common Share. This dividend is in accordance with the dividend policy of Colliers. The dividend is payable on January 12, 2024 to holders of Common Shares of record at the close of bu |
CIGI Price Returns
| 1-mo | 28.37% |
| 3-mo | 29.24% |
| 6-mo | 16.98% |
| 1-year | 39.64% |
| 3-year | 16.26% |
| 5-year | 82.63% |
| YTD | 10.35% |
| 2023 | 37.84% |
| 2022 | -37.89% |
| 2021 | 67.02% |
| 2020 | 14.48% |
| 2019 | 41.88% |
CIGI Dividends
| Ex-Dividend Date | Type | Payout Amount | Change | ||||||
|---|---|---|---|---|---|---|---|---|---|
| Loading, please wait... | |||||||||
Continue Researching CIGI
Want to do more research on Colliers International Group Inc's stock and its price? Try the links below:Colliers International Group Inc (CIGI) Stock Price | Nasdaq
Colliers International Group Inc (CIGI) Stock Quote, History and News - Yahoo Finance
Colliers International Group Inc (CIGI) Stock Price and Basic Information | MarketWatch


Loading social stream, please wait...