Ciner Resources LP Common Units representing Limited Partner Interests (CINR): Price and Financial Metrics
GET POWR RATINGS... FREE!
CINR Stock Summary
- With a one year PEG ratio of 242.83, Ciner Resources LP is expected to have a higher PEG ratio (a measure of how expensive a stock is relative to its expected earnings growth) than 90.42% of US stocks.
- Of note is the ratio of Ciner Resources LP's sales and general administrative expense to its total operating expenses; 85.99% of US stocks have a lower such ratio.
- For CINR, its debt to operating expenses ratio is greater than that reported by 83.17% of US equities we're observing.
- If you're looking for stocks that are quantitatively similar to Ciner Resources LP, a group of peers worth examining would be HEES, COOP, MHLD, BRFS, and HSC.
- CINR's SEC filings can be seen here. And to visit Ciner Resources LP's official web site, go to www.ciner.us.com.
CINR Valuation Summary
- In comparison to the median Basic Materials stock, CINR's price/earnings ratio is 9.05% lower, now standing at 18.1.
- CINR's price/earnings ratio has moved up 8.1 over the prior 97 months.
- CINR's price/sales ratio has moved down 0.3 over the prior 97 months.
Below are key valuation metrics over time for CINR.
Stock | Date | P/S | P/B | P/E | EV/EBIT |
---|---|---|---|---|---|
CINR | 2021-09-03 | 0.5 | 1.3 | 18.1 | 20.1 |
CINR | 2021-09-02 | 0.5 | 1.3 | 18.1 | 20.1 |
CINR | 2021-09-01 | 0.6 | 1.4 | 18.3 | 20.2 |
CINR | 2021-08-31 | 0.6 | 1.4 | 18.3 | 20.2 |
CINR | 2021-08-30 | 0.6 | 1.4 | 18.3 | 20.3 |
CINR | 2021-08-27 | 0.6 | 1.4 | 18.4 | 20.3 |
CINR Growth Metrics
- Its 5 year revenue growth rate is now at 5.52%.
- The 2 year revenue growth rate now stands at 3.03%.
- Its 3 year price growth rate is now at -20.33%.

The table below shows CINR's growth in key financial areas (numbers in millions of US dollars).
Date | Revenue | Operating Cash Flow | Net Income to Common Stock |
---|---|---|---|
2021-09-30 | 487.5 | 30.6 | 18.7 |
2021-06-30 | 450.1 | 41.9 | 13.6 |
2021-03-31 | 405.6 | 31.6 | 7.4 |
2020-12-31 | 392.2 | 54.7 | 11.7 |
2020-09-30 | 414.2 | 87.8 | 16.9 |
2020-06-30 | 453.2 | 107 | 29.4 |
CINR Stock Price Chart Interactive Chart >
CINR Price/Volume Stats
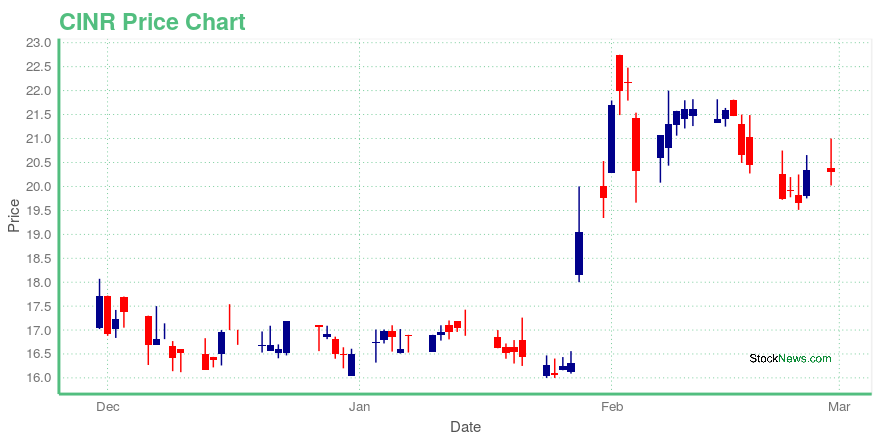
Current price | $20.31 | 52-week high | $22.75 |
Prev. close | $20.34 | 52-week low | $12.10 |
Day low | $20.02 | Volume | 22,400 |
Day high | $21.00 | Avg. volume | 23,041 |
50-day MA | $18.44 | Dividend yield | 12.8% |
200-day MA | $15.66 | Market Cap | 401.69M |
Ciner Resources LP Common Units representing Limited Partner Interests (CINR) Company Bio
OCI Resources LP engages in the trona ore mining and soda ash, which are raw materials found in flat glass, container glass, detergents, chemicals, paper, and other consumer and industrial products. The company was founded in 1996 and is based in Atlanta, Georgia.
Latest CINR News From Around the Web
Below are the latest news stories about Ciner Resources LP that investors may wish to consider to help them evaluate CINR as an investment opportunity.
Ciner Resources LP Announces Name Change to Sisecam Resources LPATLANTA, February 17, 2022--Ciner Resources LP (NYSE: CINR) ("Ciner Resources" or the "Partnership") announced today that, in connection with the previously announced sale of 60% of Sisecam Chemicals Resources LLC (formerly known as Ciner Resources Corporation) to Sisecam Chemicals USA Inc., a wholly owned subsidiary of Turkiye Sise ve Cam Fabrikalari A.S. of Istanbul, Turkey ("Sisecam"), the Partnership will change its name to Sisecam Resources LP. Such name change is expected to be effective o |
Ciner Resources and Braskem lead Energy/Material gainers; Origin Agritech among losersGainers: Ciner Resources (CINR) +17%. Braskem (BAK) +10%. Losers: Save Foods (SVFD) -8%. Fusion Fuel Green (HTOOW) -8%. Origin Agritech (SEED) -7%. |
Ciner Resources declares $0.65 dividendNo summary available. |
Ciner Resources LP Announces Quarterly Cash DistributionATLANTA, January 27, 2022--Ciner Resources LP (the "Partnership") (NYSE: CINR) announced that the board of directors of its general partner unanimously approved today its quarterly distribution. The quarterly distribution of $0.65 for the fourth quarter of 2021 is payable on February 18, 2022, to unitholders of record on February 7, 2022. |
Ciner Resources LP: Ciner Enterprises Inc. Sells Controlling Interest in Ciner Resources to Sisecam Chemicals USA Inc.Ciner Enterprises Inc. (CEI), a wholly owned subsidiary of We Soda Ltd of London, UK ("WE Soda"), has completed the previously-announced sale of 60% of Ciner Resources Corporation ("CRC") to Sisec |
CINR Price Returns
1-mo | N/A |
3-mo | N/A |
6-mo | 26.81% |
1-year | 46.96% |
3-year | 27.05% |
5-year | 0.63% |
YTD | 26.81% |
2021 | 33.47% |
2020 | -23.69% |
2019 | -12.46% |
2018 | -7.00% |
2017 | -6.11% |
CINR Dividends
Ex-Dividend Date | Type | Payout Amount | Change | ||||||
---|---|---|---|---|---|---|---|---|---|
Loading, please wait... |
Continue Researching CINR
Want to see what other sources are saying about Ciner Resources LP's financials and stock price? Try the links below:Ciner Resources LP (CINR) Stock Price | Nasdaq
Ciner Resources LP (CINR) Stock Quote, History and News - Yahoo Finance
Ciner Resources LP (CINR) Stock Price and Basic Information | MarketWatch
Loading social stream, please wait...