CI&T Inc (CINT): Price and Financial Metrics
CINT Price/Volume Stats
| Current price | $6.38 | 52-week high | $8.04 |
| Prev. close | $6.32 | 52-week low | $3.34 |
| Day low | $6.33 | Volume | 64,100 |
| Day high | $6.50 | Avg. volume | 54,927 |
| 50-day MA | $6.48 | Dividend yield | N/A |
| 200-day MA | $5.84 | Market Cap | 857.55M |
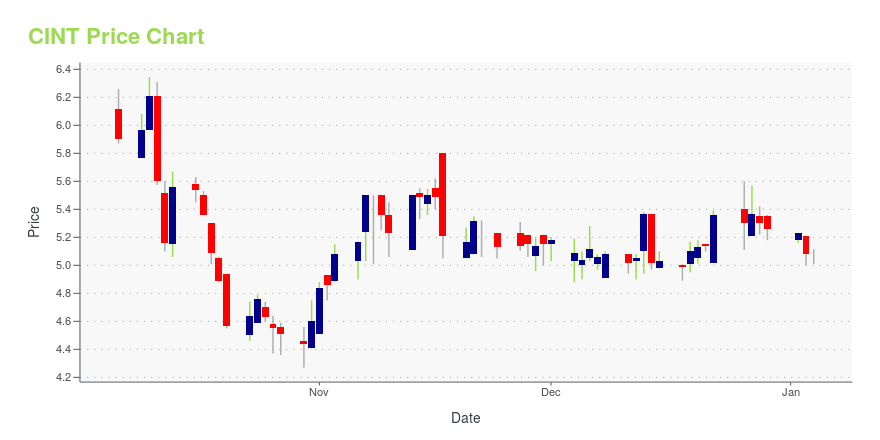
CINT Stock Price Chart Interactive Chart >
CI&T Inc (CINT) Company Bio
CI&T Inc, together with its subsidiaries, provides strategy, design, and software engineering services to enable digital transformation for enterprises worldwide. It develops customizable software through the implementation of software solutions, including machine learning, artificial intelligence, analytics, and cloud and mobility technologies. The company was founded in 1995 and is headquartered in Campinas, Brazil.
CINT Price Returns
| 1-mo | 3.07% |
| 3-mo | -8.46% |
| 6-mo | 3.07% |
| 1-year | 31.82% |
| 3-year | -54.40% |
| 5-year | N/A |
| YTD | 5.11% |
| 2024 | 15.40% |
| 2023 | -19.08% |
| 2022 | -45.33% |
| 2021 | N/A |
| 2020 | N/A |


Loading social stream, please wait...