Cleveland-Cliffs Inc. (CLF): Price and Financial Metrics
GET POWR RATINGS... FREE!
CLF POWR Grades
- CLF scores best on the Momentum dimension, with a Momentum rank ahead of 95.53% of US stocks.
- The strongest trend for CLF is in Growth, which has been heading up over the past 179 days.
- CLF's current lowest rank is in the Stability metric (where it is better than 1.19% of US stocks).
CLF Stock Summary
- CLF's one year PEG ratio, measuring expected growth in earnings next year relative to current common stock price is 0.01 -- higher than just 0.08% of US-listed equities with positive expected earnings growth.
- In terms of twelve month growth in earnings before interest and taxes, Cleveland-Cliffs Inc is reporting a growth rate of 81,860%; that's higher than 99.98% of US stocks.
- As for revenue growth, note that CLF's revenue has grown 281.84% over the past 12 months; that beats the revenue growth of 97.05% of US companies in our set.
- Stocks with similar financial metrics, market capitalization, and price volatility to Cleveland-Cliffs Inc are EGLE, PBA, ZEUS, COHU, and WBA.
- Visit CLF's SEC page to see the company's official filings. To visit the company's web site, go to www.clevelandcliffs.com.
CLF Valuation Summary
- In comparison to the median Basic Materials stock, CLF's EV/EBIT ratio is 17.76% lower, now standing at 12.5.
- Over the past 243 months, CLF's price/earnings ratio has gone up 25.3.
- CLF's price/sales ratio has moved up 0.5 over the prior 243 months.
Below are key valuation metrics over time for CLF.
Stock | Date | P/S | P/B | P/E | EV/EBIT |
---|---|---|---|---|---|
CLF | 2021-09-03 | 0.9 | 3.7 | 13.7 | 12.5 |
CLF | 2021-09-02 | 0.9 | 3.7 | 13.9 | 12.6 |
CLF | 2021-09-01 | 0.9 | 3.7 | 13.7 | 12.5 |
CLF | 2021-08-31 | 0.9 | 3.6 | 13.4 | 12.3 |
CLF | 2021-08-30 | 0.9 | 3.7 | 13.7 | 12.5 |
CLF | 2021-08-27 | 0.9 | 3.8 | 13.9 | 12.7 |
CLF Growth Metrics
- The 5 year revenue growth rate now stands at 17.04%.
- Its 3 year net cashflow from operations growth rate is now at 265.47%.
- Its year over year cash and equivalents growth rate is now at -41.14%.

The table below shows CLF's growth in key financial areas (numbers in millions of US dollars).
Date | Revenue | Operating Cash Flow | Net Income to Common Stock |
---|---|---|---|
2021-12-31 | 20,444 | 2,785 | 2,988 |
2021-09-30 | 17,354.2 | 1,440.2 | 2,159 |
2021-06-30 | 12,996.2 | 170.2 | 875 |
2021-03-31 | 9,043.9 | -479.5 | -28.9 |
2020-12-31 | 5,354 | -261 | -122 |
2020-09-30 | 3,631.9 | 121.2 | -122.8 |
CLF's Quality Factors
The “Quality” component of the POWR Ratings focuses on 31 different factors of a companies fundamentals and operational strength. Here are some key insights as we drill into the specifics of these quality attributes.- CLF has a Quality Grade of C, ranking ahead of 71.41% of graded US stocks.
- CLF's asset turnover comes in at 0.995 -- ranking 1st of 42 Non-Metallic and Industrial Metal Mining stocks.
- VMC, PZG, and SCCO are the stocks whose asset turnover ratios are most correlated with CLF.
The table below shows CLF's key quality metrics over time.
Period | Asset Turnover | Gross Margin | ROIC |
---|---|---|---|
2021-09-30 | 0.995 | 0.202 | 0.163 |
2021-06-30 | 0.863 | 0.142 | 0.082 |
2021-03-31 | 0.710 | 0.059 | 0.015 |
2020-12-31 | 0.502 | 0.047 | 0.000 |
2020-09-30 | 0.494 | 0.037 | -0.003 |
2020-06-30 | 0.417 | 0.067 | 0.006 |
CLF Price Target
For more insight on analysts targets of CLF, see our CLF price target page. And for a list of of all stocks sorted by upside potential based on analyst target price, see our Top Price Target page.
Average Price Target | $29.59 | Average Broker Recommendation | 1.65 (Moderate Buy) |
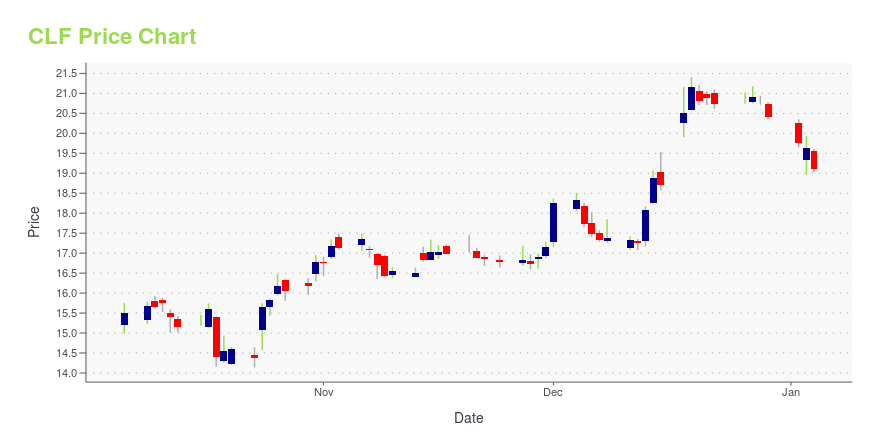
CLF Stock Price Chart Interactive Chart >
CLF Price/Volume Stats
Current price | $18.57 | 52-week high | $34.04 |
Prev. close | $18.31 | 52-week low | $14.31 |
Day low | $18.34 | Volume | 13,490,699 |
Day high | $19.11 | Avg. volume | 20,685,879 |
50-day MA | $17.84 | Dividend yield | N/A |
200-day MA | $22.02 | Market Cap | 9.61B |
Cleveland-Cliffs Inc. (CLF) Company Bio
Cleveland-Cliffs Inc. is a mining and natural resources company in the United States. The Company is a major supplier of iron ore pellets to the North American steel industry. The company was founded in 1847 and is based in Cleveland, Ohio.
Latest CLF News From Around the Web
Below are the latest news stories about Cleveland-Cliffs Inc that investors may wish to consider to help them evaluate CLF as an investment opportunity.
Why Steel Stocks Went Straight Up TodayAt approximately 10 p.m. Eastern Wednesday night, Russian military forces launched an all-out assault on their neighbor Ukraine. Calls for economic sanctions by the West were immediate -- and they're having an immediate effect on the prices of publicly traded steel stocks today. As of 2 p.m. ET, shares of United States Steel Corporation (NYSE: X) had surged 9.6%, European steel giant ArcelorMittal (NYSE: MT) was up 10.7%, and Cleveland-Cliffs (NYSE: CLF) -- which used to be AK Steel and Arcelor in the U.S. -- was up 9.7%. |
Should WisdomTree U.S. MidCap ETF (EZM) Be on Your Investing Radar?Style Box ETF report for EZM |
Kim Schrier Stock Portfolio: 10 Stocks To ConsiderIn this article, we discuss the 10 stocks to consider in the portfolio of Kim Schrier. If you want to skip our detailed analysis of these stocks, go directly to Kim Schrier Stock Portfolio: 5 Stocks To Consider. Kim Schrier is a physician and politician born in California. She is presently a member of the […] |
Cleveland-Cliffs to idle Indiana Harbor blast furnace, hike flat-rolled pricesCleveland-Cliffs < |
Cleveland-Cliffs Inc. Consensus Indicates Potential 49.2% UpsideCleveland-Cliffs Inc. with ticker code (CLF) now have 9 analysts covering the stock with the consensus suggesting a rating of ''Buy''. The range between the high target price and low target price is between 37 and 22 calculating the average target price we see 28.61. Given that the stocks previous close was at 19.18 this now indicates there is a potential upside of 49.2%. The day 50 moving average is 20.03 and the 200 moving average now moves to 21.48. The market cap for the company is $10,030m. Visit the company website at: https://www.clevelandcliffs.com [stock_market_widget type="chart" template="basic" color="green" assets=CLF" range="6mo" interval="1d" axes="true" cursor="true" api="yf"] The potential market cap would be $14,961m based on the market concensus. Cleveland-Cliffs Inc.... |
CLF Price Returns
1-mo | 20.04% |
3-mo | -13.22% |
6-mo | -11.36% |
1-year | -25.03% |
3-year | 128.25% |
5-year | 172.75% |
YTD | -14.70% |
2021 | 49.52% |
2020 | 77.38% |
2019 | 12.72% |
2018 | 6.66% |
2017 | -14.27% |
Continue Researching CLF
Want to see what other sources are saying about Cleveland-Cliffs Inc's financials and stock price? Try the links below:Cleveland-Cliffs Inc (CLF) Stock Price | Nasdaq
Cleveland-Cliffs Inc (CLF) Stock Quote, History and News - Yahoo Finance
Cleveland-Cliffs Inc (CLF) Stock Price and Basic Information | MarketWatch
Loading social stream, please wait...