
CNO Financial Group, Inc. (CNO): Price and Financial Metrics
CNO Price/Volume Stats
| Current price | $31.17 | 52-week high | $31.27 |
| Prev. close | $30.75 | 52-week low | $22.27 |
| Day low | $30.92 | Volume | 463,241 |
| Day high | $31.27 | Avg. volume | 737,547 |
| 50-day MA | $28.40 | Dividend yield | 2.08% |
| 200-day MA | $26.85 | Market Cap | 3.37B |
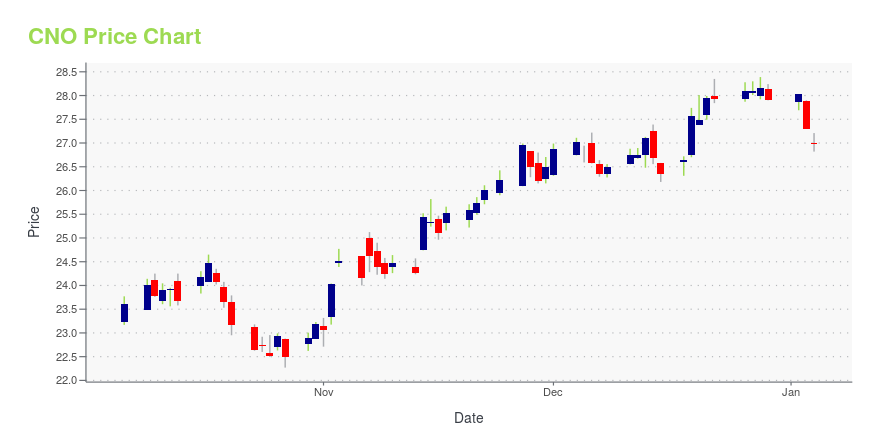
CNO Stock Price Chart Interactive Chart >
CNO Financial Group, Inc. (CNO) Company Bio
CNO Financial Group develops, markets, and administers health insurance, annuity, individual life insurance, and other insurance products for senior and middle-income markets in the United States. The company was founded in 1979 and is based in Carmel, Indiana.
Latest CNO News From Around the Web
Below are the latest news stories about CNO FINANCIAL GROUP INC that investors may wish to consider to help them evaluate CNO as an investment opportunity.
Why CNO Financial (CNO) Deserves a Spot in Your PortfolioCNO Financial's (CNO) sustained growth in insurance policy income serves as a significant positive momentum for the company. |
Should Value Investors Buy CNO Financial Group (CNO) Stock?Here at Zacks, our focus is on the proven Zacks Rank system, which emphasizes earnings estimates and estimate revisions to find great stocks. Nevertheless, we are always paying attention to the latest value, growth, and momentum trends to underscore strong picks. |
Do These 3 Checks Before Buying CNO Financial Group, Inc. (NYSE:CNO) For Its Upcoming DividendCNO Financial Group, Inc. ( NYSE:CNO ) stock is about to trade ex-dividend in 4 days. The ex-dividend date occurs one... |
CNO Financial Group to Present at the 2023 Goldman Sachs Financial Services Conference on December 5thCNO Financial Group (NYSE: CNO) announced today that Gary C. Bhojwani, chief executive officer, and Paul McDonough, chief financial officer, are scheduled to speak at the 2023 Goldman Sachs Financial Services Conference on Tuesday, December 5, at 12:20 p.m. EST, at the Conrad New York Downtown Hotel, in New York. |
The Zacks Analyst Blog Highlights MGIC Investment, CNO Financial, Old Republic International and The Hartford Financial ServicesMGIC Investment, CNO Financial, Old Republic International and The Hartford Financial Services are included in this Analyst Blog. |
CNO Price Returns
| 1-mo | 13.72% |
| 3-mo | 18.76% |
| 6-mo | 12.80% |
| 1-year | 25.09% |
| 3-year | 46.95% |
| 5-year | 111.59% |
| YTD | 13.00% |
| 2023 | 25.08% |
| 2022 | -1.57% |
| 2021 | 9.50% |
| 2020 | 25.90% |
| 2019 | 25.11% |
CNO Dividends
| Ex-Dividend Date | Type | Payout Amount | Change | ||||||
|---|---|---|---|---|---|---|---|---|---|
| Loading, please wait... | |||||||||
Continue Researching CNO
Want to see what other sources are saying about CNO Financial Group Inc's financials and stock price? Try the links below:CNO Financial Group Inc (CNO) Stock Price | Nasdaq
CNO Financial Group Inc (CNO) Stock Quote, History and News - Yahoo Finance
CNO Financial Group Inc (CNO) Stock Price and Basic Information | MarketWatch
Loading social stream, please wait...