Century Casinos, Inc. (CNTY): Price and Financial Metrics
CNTY Price/Volume Stats
Current price | $4.23 | 52-week high | $10.41 |
Prev. close | $4.18 | 52-week low | $4.12 |
Day low | $4.17 | Volume | 65,200 |
Day high | $4.30 | Avg. volume | 86,732 |
50-day MA | $4.63 | Dividend yield | N/A |
200-day MA | $6.51 | Market Cap | 128.32M |
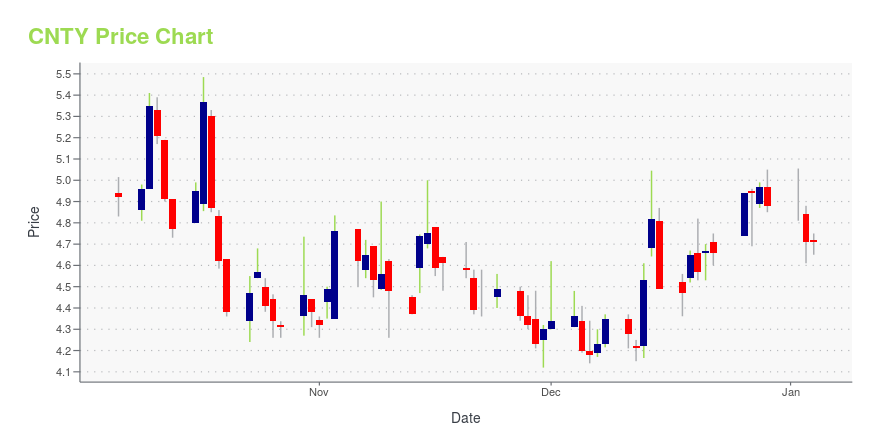
CNTY Stock Price Chart Interactive Chart >
CNTY POWR Grades
- CNTY scores best on the Momentum dimension, with a Momentum rank ahead of 65.58% of US stocks.
- CNTY's strongest trending metric is Quality; it's been moving down over the last 177 days.
- CNTY ranks lowest in Growth; there it ranks in the 22nd percentile.
CNTY Stock Summary
- CENTURY CASINOS INC's capital turnover -- a measure of revenue relative to shareholder's equity -- is better than 87.13% of US listed stocks.
- CNTY's price/sales ratio is 0.26; that's higher than the P/S ratio of merely 8.75% of US stocks.
- With a year-over-year growth in debt of 52.97%, CENTURY CASINOS INC's debt growth rate surpasses 86.74% of about US stocks.
- Stocks that are quantitatively similar to CNTY, based on their financial statements, market capitalization, and price volatility, are HRI, GLT, CENX, SHC, and PTVE.
- CNTY's SEC filings can be seen here. And to visit CENTURY CASINOS INC's official web site, go to www.cnty.com.
CNTY Valuation Summary
- In comparison to the median Consumer Cyclical stock, CNTY's price/sales ratio is 57.14% lower, now standing at 0.3.
- CNTY's price/sales ratio has moved down 1.1 over the prior 243 months.
Below are key valuation metrics over time for CNTY.
Stock | Date | P/S | P/B | P/E | EV/EBIT |
---|---|---|---|---|---|
CNTY | 2023-12-01 | 0.3 | 1.0 | -6.2 | 15.4 |
CNTY | 2023-11-30 | 0.3 | 1.0 | -6.1 | 15.4 |
CNTY | 2023-11-29 | 0.3 | 1.0 | -6.0 | 15.3 |
CNTY | 2023-11-28 | 0.3 | 1.0 | -6.1 | 15.4 |
CNTY | 2023-11-27 | 0.3 | 1.0 | -6.2 | 15.4 |
CNTY | 2023-11-24 | 0.3 | 1.1 | -6.4 | 15.5 |
CNTY Growth Metrics
- Its 4 year revenue growth rate is now at 81.88%.
- The 3 year price growth rate now stands at 15.79%.
- The 5 year cash and equivalents growth rate now stands at 60.22%.

The table below shows CNTY's growth in key financial areas (numbers in millions of US dollars).
Date | Revenue | Operating Cash Flow | Net Income to Common Stock |
---|---|---|---|
2022-09-30 | 434.076 | 47.197 | 15.978 |
2022-06-30 | 438.134 | 62.584 | 24.26 |
2022-03-31 | 419.197 | 65.654 | 22.259 |
2021-12-31 | 388.506 | 59.19 | 20.622 |
2021-09-30 | 366.012 | 52.269 | 23.375 |
2021-06-30 | 345.108 | 32.061 | 15.897 |
CNTY's Quality Factors
The “Quality” component of the POWR Ratings focuses on 31 different factors of a companies fundamentals and operational strength. Here are some key insights as we drill into the specifics of these quality attributes.- CNTY has a Quality Grade of B, ranking ahead of 88.13% of graded US stocks.
- CNTY's asset turnover comes in at 0.508 -- ranking 40th of 79 Restaraunts Hotels Motels stocks.
- MAR, EAT, and GTIM are the stocks whose asset turnover ratios are most correlated with CNTY.
The table below shows CNTY's key quality metrics over time.
Period | Asset Turnover | Gross Margin | ROIC |
---|---|---|---|
2021-06-30 | 0.508 | 0.520 | 0.062 |
2021-03-31 | 0.429 | 0.524 | 0.042 |
2020-12-31 | 0.453 | 0.508 | 0.000 |
2020-09-30 | 0.419 | 0.491 | -0.034 |
2020-06-30 | 0.406 | 0.464 | -0.054 |
2020-03-31 | 0.501 | 0.466 | -0.062 |
CNTY Price Target
For more insight on analysts targets of CNTY, see our CNTY price target page. And for a list of of all stocks sorted by upside potential based on analyst target price, see our Top Price Target page.
Average Price Target | $20.67 | Average Broker Recommendation | 1.33 (Strong Buy) |
Century Casinos, Inc. (CNTY) Company Bio
Century Casinos, Inc. develops and operates gaming establishments worldwide. It also provides lodging, restaurant, and entertainment facilities related to gaming establishments. The company was founded in 1992 and is based in Colorado Springs, Colorado.
Latest CNTY News From Around the Web
Below are the latest news stories about CENTURY CASINOS INC that investors may wish to consider to help them evaluate CNTY as an investment opportunity.
Century Casinos to Present at Truist Securities SummitCentury Casinos, Inc. (the "Company") (Nasdaq Capital Market®: CNTY) announced today that it will attend the Gaming, Lodging, Leisure & Restaurants Summit hosted by Truist Securities in Boston, Massachusetts, USA on December 7, 2023. |
Century Casinos, Inc. (NASDAQ:CNTY) Q3 2023 Earnings Call TranscriptCentury Casinos, Inc. (NASDAQ:CNTY) Q3 2023 Earnings Call Transcript November 9, 2023 Century Casinos, Inc. misses on earnings expectations. Reported EPS is $-0.47 EPS, expectations were $0.15. Operator: Good day, everyone, and welcome to the Century Casinos Q3 2023 earnings call and webcast. [Operator Instructions]. Please note today’s call will be recorded, and I will […] |
Century Casinos (CNTY) Q3 Earnings Miss Estimates, Stock DipsCentury Casinos' (CNTY) third-quarter 2023 top line is aided by robust revenues from the United States. |
Century Casinos to Present at Deutsche Bank Securities ConferenceCentury Casinos, Inc. (the "Company") (Nasdaq Capital Market®: CNTY) announced today that it will attend the Gaming, Lodging, Leisure & Restaurants One on One Conference hosted by Deutsche Bank in Miami Beach, Florida, USA, on November 16, 2023. |
Q3 2023 Century Casinos Inc Earnings CallQ3 2023 Century Casinos Inc Earnings Call |
CNTY Price Returns
1-mo | -6.62% |
3-mo | -24.73% |
6-mo | -41.98% |
1-year | -42.37% |
3-year | -37.79% |
5-year | -38.07% |
YTD | -39.83% |
2022 | -42.28% |
2021 | 90.61% |
2020 | -19.32% |
2019 | 7.17% |
2018 | -19.06% |
Continue Researching CNTY
Want to do more research on Century Casinos Inc's stock and its price? Try the links below:Century Casinos Inc (CNTY) Stock Price | Nasdaq
Century Casinos Inc (CNTY) Stock Quote, History and News - Yahoo Finance
Century Casinos Inc (CNTY) Stock Price and Basic Information | MarketWatch
Loading social stream, please wait...