Conn's, Inc. (CONN): Price and Financial Metrics

Conn's, Inc. (CONN): $4.45

0.32 (+7.75%)

POWR Rating

Component Grades

Momentum

D

Stability

D

Sentiment

Quality

C

Add CONN to Watchlist
Sign Up

Industry: Specialty Retailers

Industry

D

Ranked

#37 of 44

in industry

CONN Price/Volume Stats

Current price $4.45 52-week high $12.79
Prev. close $4.13 52-week low $3.07
Day low $3.96 Volume 342,800
Day high $4.48 Avg. volume 260,251
50-day MA $4.88 Dividend yield N/A
200-day MA $7.64 Market Cap 107.42M

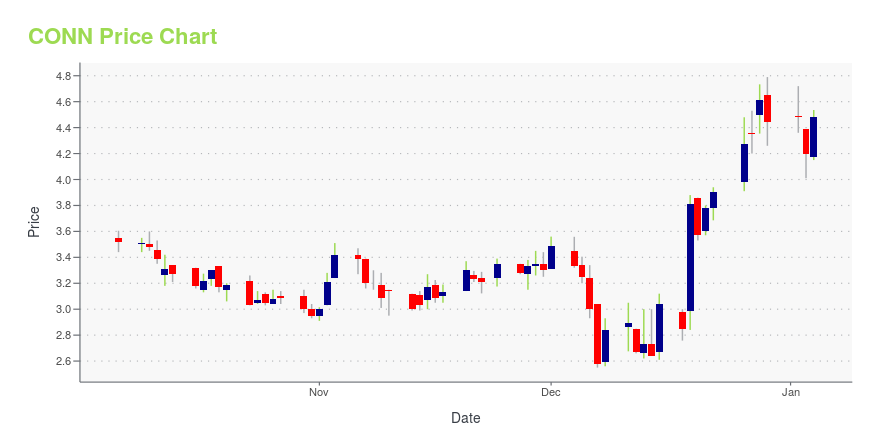
CONN Stock Price Chart Interactive Chart >

CONN POWR Grades

  • Quality is the dimension where CONN ranks best; there it ranks ahead of 71.16% of US stocks.
  • The strongest trend for CONN is in Growth, which has been heading up over the past 179 days.
  • CONN ranks lowest in Growth; there it ranks in the 2nd percentile.

CONN Stock Summary

  • The price/operating cash flow metric for CONNS INC is higher than just 7.54% of stocks in our set with a positive cash flow.
  • With a price/sales ratio of 0.08, CONNS INC has a higher such ratio than just 1.7% of stocks in our set.
  • CONNS INC's shareholder yield -- a measure of how much capital is returned to stockholders via dividends and buybacks -- is -41.2%, greater than the shareholder yield of only 12.2% of stocks in our set.
  • Stocks that are quantitatively similar to CONN, based on their financial statements, market capitalization, and price volatility, are SGC, JVA, NX, AAME, and MATW.
  • CONN's SEC filings can be seen here. And to visit CONNS INC's official web site, go to www.conns.com.

CONN Valuation Summary

  • CONN's price/earnings ratio is -1.7; this is 112.69% lower than that of the median Consumer Cyclical stock.
  • CONN's price/sales ratio has moved down 0.7 over the prior 237 months.

Below are key valuation metrics over time for CONN.

Stock Date P/S P/B P/E EV/EBIT
CONN 2023-05-19 0.1 0.2 -1.7 -36.1
CONN 2023-05-18 0.1 0.2 -1.8 -36.3
CONN 2023-05-17 0.1 0.2 -1.7 -36.1
CONN 2023-05-16 0.1 0.2 -1.6 -35.9
CONN 2023-05-15 0.1 0.2 -1.8 -36.2
CONN 2023-05-12 0.1 0.2 -1.7 -36.1

CONN Growth Metrics

    Its 3 year net cashflow from operations growth rate is now at 40.26%.
  • Its 3 year price growth rate is now at -30.19%.
  • Its 2 year net cashflow from operations growth rate is now at -49.3%.
Over the past 49 months, CONN's revenue has gone down $127,076,000.

The table below shows CONN's growth in key financial areas (numbers in millions of US dollars).

Date Revenue Operating Cash Flow Net Income to Common Stock
2022-09-30 1,410.141 81.257 -8.925
2022-06-30 1,494.399 62.289 34.153
2022-03-31 1,566.15 92.745 69.028
2021-12-31 1,590.031 176.402 108.205
2021-09-30 1,555.334 244.329 125.767
2021-06-30 1,484.034 333.329 114.947

CONN's Quality Factors

The “Quality” component of the POWR Ratings focuses on 31 different factors of a companies fundamentals and operational strength. Here are some key insights as we drill into the specifics of these quality attributes.
  • CONN has a Quality Grade of A, ranking ahead of 95.15% of graded US stocks.
  • CONN's asset turnover comes in at 0.838 -- ranking 146th of 165 Retail stocks.
  • BOOT, TCS, and WSM are the stocks whose asset turnover ratios are most correlated with CONN.

The table below shows CONN's key quality metrics over time.

Period Asset Turnover Gross Margin ROIC
2021-07-31 0.838 0.498 0.072
2021-04-30 0.795 0.507 0.063
2021-01-31 0.714 0.518 0.011
2020-10-31 0.699 0.530 0.007
2020-07-31 0.701 0.537 0.010
2020-04-30 0.692 0.544 0.010

CONN Price Target

For more insight on analysts targets of CONN, see our CONN price target page. And for a list of of all stocks sorted by upside potential based on analyst target price, see our Top Price Target page.

Average Price Target $33.00 Average Broker Recommendation 1.75 (Moderate Buy)

Conn's, Inc. (CONN) Company Bio


Conn's, Inc. operates as a specialty retailer of durable consumer goods and related services in the United States. It operates through Retail and Credit segments. The company’s stores provide home appliances comprising refrigerators, freezers, washers, dryers, dishwashers, and ranges; furniture and mattress, including furniture and related accessories for the living room, dining room, and bedroom, as well as traditional and specialty mattresses; and home office products consisting of computers, tablets, printers, and accessories. The company was founded in 1890 and is based in The Woodlands, Texas.


CONN Latest News Stream


Event/Time News Detail
Loading, please wait...

CONN Latest Social Stream


Loading social stream, please wait...

View Full CONN Social Stream

Latest CONN News From Around the Web

Below are the latest news stories about CONNS INC that investors may wish to consider to help them evaluate CONN as an investment opportunity.

Bear of the Day: Conn's (CONN)

In investing there are pros and CONNs to any question.

Yahoo | April 18, 2023

Conn’s, Inc. (NASDAQ:CONN) Q4 2023 Earnings Call Transcript

Conn’s, Inc. (NASDAQ:CONN) Q4 2023 Earnings Call Transcript March 29, 2023 Operator: Good morning, and thank you for holding. Welcome to the Conn’s, Inc. Conference Call to Discuss Earnings for the Fiscal Quarter-ended January 31, 2023. My name is Doug, and I’ll be your operator today. During the presentation, all participants will be in a […]

Yahoo | April 10, 2023

Conn's Q4 Highlights: Topline Beat, Bottomline Miss, Warning On Challenging Economic Landscape & More

Conn's Inc (NASDAQ: CONN) reported a fourth-quarter FY23 sales decline of 16.8% year-over-year to $334.88 million, beating the consensus of $331.55 million. Same-store sales decreased by 21.8% versus last year, and eCommerce sales increased to $24.2 million. Adjusted EPS loss of $(1.53) missed the consensus of $(0.87). Retail revenues decreased by 18.7% Y/Y, primarily driven by a decrease in same-store sales. Credit segment revenues declined 7.8% Y/Y to $64.1 million, primarily due to a decrease

Yahoo | March 29, 2023

Conn's (CONN) Reports Q4 Loss, Tops Revenue Estimates

Conn's (CONN) delivered earnings and revenue surprises of -84.34% and 1.33%, respectively, for the quarter ended January 2023. Do the numbers hold clues to what lies ahead for the stock?

Yahoo | March 29, 2023

Conn’s, Inc. Reports Fourth Quarter and Full Year Fiscal Year 2023 Financial Results

THE WOODLANDS, Texas, March 29, 2023 (GLOBE NEWSWIRE) -- Conn’s, Inc. (NASDAQ: CONN) (“Conn’s” or the “Company”), a specialty retailer of home goods, including furniture, appliances and consumer electronics, with a mission to elevate home life to home love, today announced its financial results for the quarter and year ended January 31, 2023. “Our fourth quarter performance reflects the actions underway to refocus our efforts on serving our core credit constrained customers as we continue to fac

Yahoo | March 29, 2023

Read More 'CONN' Stories Here

CONN Price Returns

1-mo 2.53%
3-mo -50.11%
6-mo -48.44%
1-year -60.16%
3-year -46.58%
5-year -81.02%
YTD -35.32%
2022 -70.75%
2021 101.20%
2020 -5.65%
2019 -34.31%
2018 -46.95%

Continue Researching CONN

Here are a few links from around the web to help you further your research on Conns Inc's stock as an investment opportunity:

Conns Inc (CONN) Stock Price | Nasdaq
Conns Inc (CONN) Stock Quote, History and News - Yahoo Finance
Conns Inc (CONN) Stock Price and Basic Information | MarketWatch

Get Free Updates

Join thousands of investors who get the latest news, insights and top rated picks from StockNews.com!