Coty Inc. (COTY): Price and Financial Metrics
GET POWR RATINGS... FREE!
COTY Price/Volume Stats
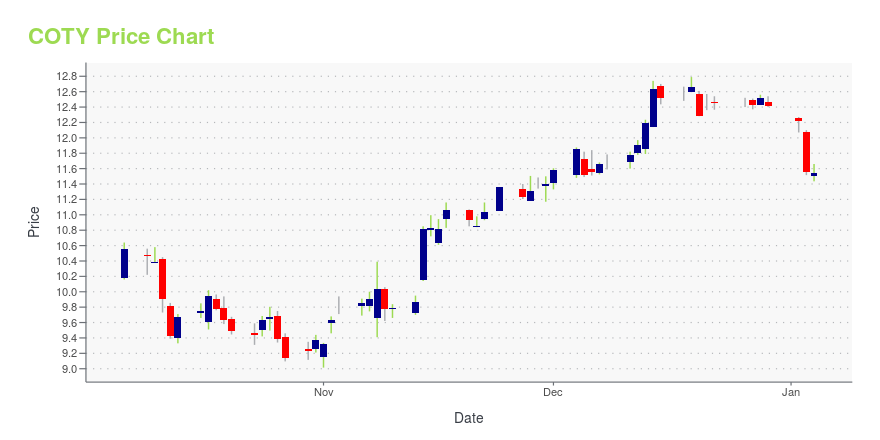
Current price | $11.03 | 52-week high | $12.64 |
Prev. close | $10.97 | 52-week low | $6.19 |
Day low | $10.76 | Volume | 5,216,300 |
Day high | $11.11 | Avg. volume | 5,719,076 |
50-day MA | $11.68 | Dividend yield | N/A |
200-day MA | $9.24 | Market Cap | 9.41B |
COTY Stock Price Chart Interactive Chart >
COTY POWR Grades
- COTY scores best on the Growth dimension, with a Growth rank ahead of 98.16% of US stocks.
- The strongest trend for COTY is in Value, which has been heading down over the past 179 days.
- COTY's current lowest rank is in the Momentum metric (where it is better than 10.65% of US stocks).
COTY Stock Summary
- With a market capitalization of $9,176,093,697, COTY INC has a greater market value than 83.62% of US stocks.
- COTY's current price/earnings ratio is 50.81, which is higher than 88.73% of US stocks with positive earnings.
- Of note is the ratio of COTY INC's sales and general administrative expense to its total operating expenses; 77.73% of US stocks have a lower such ratio.
- Stocks that are quantitatively similar to COTY, based on their financial statements, market capitalization, and price volatility, are WOR, MMS, MAT, LECO, and DGX.
- Visit COTY's SEC page to see the company's official filings. To visit the company's web site, go to www.coty.com.
COTY Valuation Summary
- In comparison to the median Consumer Defensive stock, COTY's price/sales ratio is 5.56% lower, now standing at 1.7.
- COTY's price/earnings ratio has moved up 72.3 over the prior 121 months.
Below are key valuation metrics over time for COTY.
Stock | Date | P/S | P/B | P/E | EV/EBIT |
---|---|---|---|---|---|
COTY | 2023-05-23 | 1.7 | 2.5 | 51.8 | 24.5 |
COTY | 2023-05-22 | 1.8 | 2.5 | 52.5 | 24.7 |
COTY | 2023-05-19 | 1.8 | 2.6 | 53.1 | 24.9 |
COTY | 2023-05-18 | 1.8 | 2.6 | 53.5 | 25.1 |
COTY | 2023-05-17 | 1.8 | 2.6 | 53.4 | 25.0 |
COTY | 2023-05-16 | 1.8 | 2.6 | 52.8 | 24.8 |
COTY Growth Metrics
- Its 5 year cash and equivalents growth rate is now at 65.61%.
- Its year over year cash and equivalents growth rate is now at 95.59%.
- The year over year net cashflow from operations growth rate now stands at 2454.19%.

The table below shows COTY's growth in key financial areas (numbers in millions of US dollars).
Date | Revenue | Operating Cash Flow | Net Income to Common Stock |
---|---|---|---|
2022-12-31 | 5,268.1 | 637.3 | 125.8 |
2022-09-30 | 5,322.7 | 604.1 | 83.5 |
2022-06-30 | 5,304.4 | 726.6 | 61.2 |
2022-03-31 | 5,198.5 | 791.8 | 135.8 |
2021-12-31 | 5,040.1 | 580.7 | 67 |
2021-09-30 | 4,877.5 | 561.8 | -401.1 |
COTY's Quality Factors
The “Quality” component of the POWR Ratings focuses on 31 different factors of a companies fundamentals and operational strength. Here are some key insights as we drill into the specifics of these quality attributes.- COTY has a Quality Grade of C, ranking ahead of 57.71% of graded US stocks.
- COTY's asset turnover comes in at 0.313 -- ranking 45th of 50 Consumer Goods stocks.
- IKNX, IPAR, and UG are the stocks whose asset turnover ratios are most correlated with COTY.
The table below shows COTY's key quality metrics over time.
Period | Asset Turnover | Gross Margin | ROIC |
---|---|---|---|
2021-06-30 | 0.313 | 0.598 | -0.015 |
2021-03-31 | 0.159 | 0.507 | -0.111 |
2020-12-31 | 0.177 | 0.514 | -0.130 |
2020-09-30 | 0.222 | 0.559 | -0.103 |
2020-06-30 | 0.271 | 0.578 | -0.104 |
2020-03-31 | 0.449 | 0.620 | -0.286 |
Coty Inc. (COTY) Company Bio
Coty Inc., together with its subsidiaries, manufactures, markets, and distributes beauty products worldwide. The company operates through four segments: Fragrances, Color Cosmetics, Skin & Body Care, and Brazil Acquisition. The company was founded in 1904 and is headquartered in New York, New York.
Latest COTY News From Around the Web
Below are the latest news stories about COTY INC that investors may wish to consider to help them evaluate COTY as an investment opportunity.
The Zacks Analyst Blog Highlights Celsius Holdings, The Clorox, Lamb Weston Holdings, Coty and Inter ParfumsCelsius Holdings, The Clorox, Lamb Weston Holdings, Coty and Inter Parfums are part of the Zacks top Analyst Blog. |
U.S. Consumer Sentiment Tumbles in May: 5 Safe Stocks to BuyWe have narrowed our search to five consumer staples stocks . These are: CELH, CLX, COTY, LW and IPAR. |
Coty Introduces Orveda Serum and Infiniment Coty Paris Fragrance as the Company Charts a New Course at Gala Event in CannesCANNES, France, May 13, 2023--Today, Coty Inc. (NYSE: COTY), one of the world’s largest beauty companies with a portfolio of iconic brands across fragrance, color cosmetics, skin and body care, announces the launch of an innovative new serum by ultra-premium skincare line Orveda and Infiniment Coty Paris, the Company’s most ambitious fragrance project to date. |
Calculating The Fair Value Of Coty Inc. (NYSE:COTY)Key Insights Coty's estimated fair value is US$10.92 based on 2 Stage Free Cash Flow to Equity Current share price of... |
12 Best Household and Personal Care Stocks To BuyIn this article, we discuss 12 best household and personal care stocks to buy. If you want to see more stocks in this selection, check out 5 Best Household and Personal Care Stocks To Buy. Proficient Market Insights reported that the worldwide market for beauty and personal care products sold online was worth $56,533.35 million […] |
COTY Price Returns
1-mo | -7.08% |
3-mo | -2.39% |
6-mo | 40.15% |
1-year | 55.79% |
3-year | 203.86% |
5-year | -12.15% |
YTD | 28.86% |
2022 | -18.48% |
2021 | 49.57% |
2020 | -36.92% |
2019 | 79.18% |
2018 | -65.68% |
Continue Researching COTY
Want to do more research on Coty Inc's stock and its price? Try the links below:Coty Inc (COTY) Stock Price | Nasdaq
Coty Inc (COTY) Stock Quote, History and News - Yahoo Finance
Coty Inc (COTY) Stock Price and Basic Information | MarketWatch
Loading social stream, please wait...