CRA International,Inc. (CRAI): Price and Financial Metrics
GET POWR RATINGS... FREE!
CRAI POWR Grades
- CRAI scores best on the Quality dimension, with a Quality rank ahead of 90.2% of US stocks.
- The strongest trend for CRAI is in Stability, which has been heading down over the past 179 days.
- CRAI ranks lowest in Sentiment; there it ranks in the 9th percentile.
CRAI Stock Summary
- The capital turnover (annual revenue relative to shareholder's equity) for CRAI is 2.8 -- better than 81.75% of US stocks.
- CRAI's one year PEG ratio, measuring expected growth in earnings next year relative to current common stock price is 181.85 -- higher than 85.24% of US-listed equities with positive expected earnings growth.
- The price/operating cash flow metric for CRA INTERNATIONAL INC is higher than 85.22% of stocks in our set with a positive cash flow.
- Stocks with similar financial metrics, market capitalization, and price volatility to CRA INTERNATIONAL INC are ODC, HUBG, CPRI, CHX, and ASGN.
- Visit CRAI's SEC page to see the company's official filings. To visit the company's web site, go to www.crai.com.
CRAI Valuation Summary
- In comparison to the median Industrials stock, CRAI's price/sales ratio is 18.18% higher, now standing at 1.3.
- CRAI's price/earnings ratio has moved up 0.2 over the prior 243 months.
Below are key valuation metrics over time for CRAI.
Stock | Date | P/S | P/B | P/E | EV/EBIT |
---|---|---|---|---|---|
CRAI | 2023-03-17 | 1.3 | 3.8 | 18.2 | 14.6 |
CRAI | 2023-03-16 | 1.4 | 3.8 | 18.6 | 14.9 |
CRAI | 2023-03-15 | 1.4 | 3.8 | 18.3 | 14.7 |
CRAI | 2023-03-14 | 1.4 | 3.8 | 18.4 | 14.7 |
CRAI | 2023-03-13 | 1.3 | 3.7 | 17.7 | 14.2 |
CRAI | 2023-03-10 | 1.4 | 3.8 | 18.4 | 14.7 |
CRAI Growth Metrics
- Its year over year net cashflow from operations growth rate is now at -33.02%.
- The 4 year revenue growth rate now stands at 42.06%.
- Its 3 year net income to common stockholders growth rate is now at 91.3%.

The table below shows CRAI's growth in key financial areas (numbers in millions of US dollars).
Date | Revenue | Operating Cash Flow | Net Income to Common Stock |
---|---|---|---|
2022-12-31 | 590.901 | 25.121 | 43.619 |
2022-09-30 | 580.691 | 26.78 | 43.613 |
2022-06-30 | 568.662 | 33.109 | 42.681 |
2022-03-31 | 567.797 | 53.708 | 42.604 |
2021-12-31 | 565.933 | 75.698 | 41.679 |
2021-09-30 | 568.589 | 79.218 | 39.717 |
CRAI's Quality Factors
The “Quality” component of the POWR Ratings focuses on 31 different factors of a companies fundamentals and operational strength. Here are some key insights as we drill into the specifics of these quality attributes.- CRAI has a Quality Grade of B, ranking ahead of 81.89% of graded US stocks.
- CRAI's asset turnover comes in at 1.014 -- ranking 10th of 50 Personal Services stocks.
- MNRO, STON, and CAR are the stocks whose asset turnover ratios are most correlated with CRAI.
The table below shows CRAI's key quality metrics over time.
Period | Asset Turnover | Gross Margin | ROIC |
---|---|---|---|
2021-07-03 | 1.014 | 0.278 | 0.114 |
2021-04-03 | 0.961 | 0.272 | 0.094 |
2021-01-02 | 0.921 | 0.271 | 0.081 |
2020-09-26 | 0.899 | 0.278 | 0.073 |
2020-06-27 | 0.906 | 0.278 | 0.073 |
2020-03-28 | 0.909 | 0.290 | 0.075 |
CRAI Price Target
For more insight on analysts targets of CRAI, see our CRAI price target page. And for a list of of all stocks sorted by upside potential based on analyst target price, see our Top Price Target page.
Average Price Target | $110.00 | Average Broker Recommendation | 1.5 (Moderate Buy) |
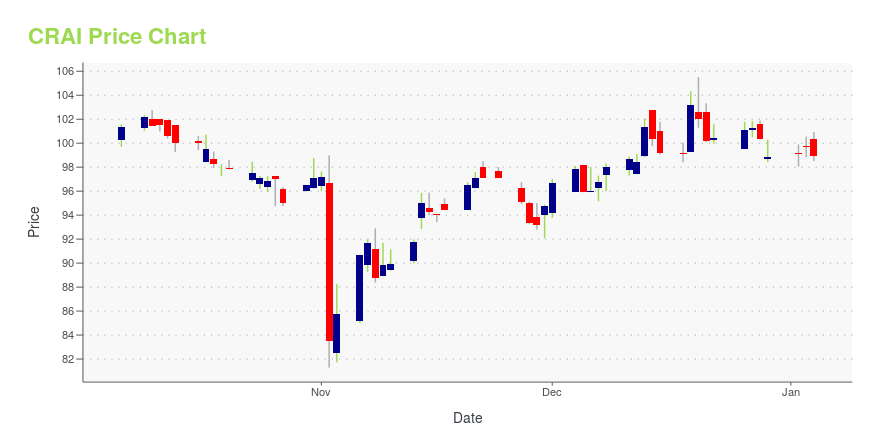
CRAI Stock Price Chart Interactive Chart >
CRAI Price/Volume Stats
Current price | $108.56 | 52-week high | $128.10 |
Prev. close | $107.01 | 52-week low | $78.35 |
Day low | $105.50 | Volume | 24,962 |
Day high | $108.91 | Avg. volume | 72,202 |
50-day MA | $118.00 | Dividend yield | 1.34% |
200-day MA | $104.69 | Market Cap | 779.79M |
CRA International,Inc. (CRAI) Company Bio
CRA International, Inc. provides economic, financial, and management consulting services worldwide. The company was founded in 1965 and is based in Boston, Massachusetts.
Latest CRAI News From Around the Web
Below are the latest news stories about CRA INTERNATIONAL INC that investors may wish to consider to help them evaluate CRAI as an investment opportunity.
Sidoti's Small-Cap Virtual March ConferenceSidoti & Company, LLC has released the presentation schedule and weblinks for its two-day March Small-Cap Conference taking place Wednesday and Thursday, March 22-23, 2023. |
Charles River Associates (CRA) Expands Its Energy PracticeBOSTON, March 16, 2023--Charles River Associates (NASDAQ: CRAI), a worldwide leader in providing economic, financial and management consulting services, today announced that Alpaslan Dilekci has joined the company’s Energy Practice in Europe as a vice president. |
Charles River Associates (CRA) to Present at Sidoti Small-Cap Virtual Investor ConferenceBOSTON, March 14, 2023--Charles River Associates (NASDAQ: CRAI), a worldwide leader in providing economic, financial, and management consulting services, announced today that the Company will present at the Sidoti Small-Cap Virtual Conference on Wednesday, March 22, 2023. CRA Chairman and Chief Executive Officer Paul Maleh is scheduled to present at 10:45 a.m. ET. |
FirstEnergy Ohio Utilities’ PIPP RFP Auction: Information Sessions for Prospective Bidders on Thursday, March 9, 2023BOSTON, March 08, 2023--CRA International, Inc. (NASDAQ: CRAI), a worldwide leader in providing economic, financial, and management consulting services, today announced that an RFP auction process will be conducted for FirstEnergy Corp.’s (NYSE: FE) Ohio utilities to procure full requirements service for their Percentage of Income Payment Plan (PIPP) customers. The winning PIPP supplier will be obligated to serve all of the PIPP load for the 12-month delivery period June 2023 through May 2024. |
CRA International, Inc. (NASDAQ:CRAI) Looks Interesting, And It's About To Pay A DividendRegular readers will know that we love our dividends at Simply Wall St, which is why it's exciting to see CRA... |
CRAI Price Returns
1-mo | -12.15% |
3-mo | -9.23% |
6-mo | 28.23% |
1-year | 27.07% |
3-year | 279.68% |
5-year | 130.97% |
YTD | -11.04% |
2022 | 32.94% |
2021 | 85.67% |
2020 | -4.47% |
2019 | 30.42% |
2018 | -4.04% |
CRAI Dividends
Ex-Dividend Date | Type | Payout Amount | Change | ||||||
---|---|---|---|---|---|---|---|---|---|
Loading, please wait... |
Continue Researching CRAI
Want to see what other sources are saying about Cra International Inc's financials and stock price? Try the links below:Cra International Inc (CRAI) Stock Price | Nasdaq
Cra International Inc (CRAI) Stock Quote, History and News - Yahoo Finance
Cra International Inc (CRAI) Stock Price and Basic Information | MarketWatch
Loading social stream, please wait...